 About Authors:
Middha Akanksha*, Kataria Sahil, Sandhu Premjeet, Arora Praveen
Seth G. L. Bihani S.D. College of Technical Education,
Institute of Pharmaceutical Sciences and Drug Research,
Sri Ganganagar, Rajasthan,
INDIA
*Akankshamddh@gmail.com
Abstract
Nuclear Magnetic Resonance (NMR) Spectroscopy is not limited to the study of protons. Any element with a nuclear spin (13C, 17O, 19F, 31P and many others) will give rise to an NMR signal.Carbon-13 NMR (13C NMR or referred to as carbon NMR) is the application of nuclear magnetic resonance (NMR) spectroscopy applicable to carbon. It is similar to proton NMR (1 H NMR) and allows the identification of carbon atoms whereas in other identification of H. As such 13C NMR is an important tool in chemical structure elucidation in organic chemistry. 13C NMR detects only the 13C isotope of carbon, whose natural abundance is only 1.1%, because the main carbon isotope, 12 C, is not detectable by NMR since it has zero net spin.
[adsense:336x280:8701650588]
Reference Id: PHARMATUTOR-ART-1203
C-NMR Spectroscopy
It is useful to compare and contrast H-NMR and C-NMR as there are certain differences and similarities:
- 13C has only about 1.1% natural abundance (of carbon atoms)
- 12C does not exhibit NMR behaviour (I=0)
- 13C nucleus is also a spin 1/2 nucleus
- 13C nucleus is about 400 times less sensitive than H nucleus to the NMR phenomena
- Due to the low abundance, we do not usually see 13C-13C coupling
- Chemical shift range is normally 0 to 220 ppm
- Chemical shifts are also measured with respect to tetramethylsilane, (CH3)4Si (i.e. TMS)
- Similar factors affect the chemical shifts in 13C as seen for H-NMR
- Long relaxation times (excited state to ground state) mean no integrations
- "Normal" 13C spectra are "broadband, proton decoupled" so the peaks show as single lines
- Number of peaks indicates the number of types of C
The general implications of these points are that 13C-NMR spectra take longer to acquire than H-NMR, though they tend to look simpler. Accidental overlap of peaks is much less common than for H-NMR which makes it easier to determine how many types of C are present6
In comparison to 1H NMR spectroscopy, 13C NMR spectra are more easily interpreted and give following information:
1. The common range of energy absorption for 13C is wide δ 0 – 200 relative to TMS, contrasted with δ 0-15 for 1H NMR. Thus fewer peaks overlap in 13C NMR spectra
2. Because only 1.1% of carbon in a compound is 13C, 13C- 13C coupling is negligible and thus is not observed. Therefore, in one type of 13C NMR Spectra( proton decoupled) each magnetically non equivalent carbon gives a single unsplit peak
The presence of plane of symmetry in an organic molecule may render some carbons chemically equivalent to others. This may lead to discrepancy between the apparent number of peaks and the actual number of carbon atoms present in the molecule
3. The area under the peaks in 13C NMR Spectra are not necessarily proportional to the number of carbons giving rise to the signals.
4. The proton coupled spectra, the signal for each carbon (or a group of magnetically equivalent carbons) is split by the protons bonded directly to that carbon and n+1 rule is followed.3
Carbon -13 NMR spectroscopy is similar to proton NMR in that the no. of the peaks in the spectrum normally corresponds to the number of different carbon enviornments and the chemical shifts of carbon signals provide some indication of nature of each enviornment.
Carbon -13 NMR differs from proton NMR in that integration is normally
Table 1: Comparison of Different Nuclear Characteristics8

There are three short-comings of 13C-NMR spectra, namely :
(1) Only 1% of the carbon in the molecule is carbon-13,
(2) Sensitivity is consequently low, and
(3) Recording the NMR-spectra is a tedious and time consuming process. However, with the advent of recent developments in NMR-spectroscopy it is quite possible to eliminate some of these short comings adequately. They are :
(a) Development of powerful magnets (‘supercon’ magnets) has ultimately resulted in relatively stronger NMR-signals from the same number of atoms,
(b) Improved hardware in NMR-spectroscopy has gainfully accomplished higher sensitivity, and
(c) Development of more sensitive strategies has made it possible to record these C—H correlation spectra in a much easier manner.8
Whereas carbon-carbon signal splitting does not occur in 13C NMR spectra, hydrogen atoms attached to carbon can split 13C NMR signals into multiplet peaks. However it is useful to simplify the appearance of 13C NMR spectra by initially eliminating signal splitting for 1H -13C coupling. This can be done by choosing instrumental parameters that decouple the proton-carbon interactions and such a spectra is said to be broadband(BB) proton decoupled, thus in a broadband proton decoupled 13C NMR spectrum each carbon atom in a unique environment gives a signal consisting of only one peak. Most 13C NMR spectra are obtained in the simplified broadband mode first and then in modes that provide information from the 1H-13C couplings.4
The background to C-13 NMR spectroscopy
Nuclear magnetic resonance is concerned with the magnetic properties of certain nuclei. On this page we are focussing on the magnetic behaviour of carbon-13 nuclei.
Carbon-13 nuclei as little magnets
About 1% of all carbon atoms are the C-13 isotope; the rest (apart from tiny amounts of the radioactive C-14) is C-12. C-13 NMR relies on the magnetic properties of the C-13 nuclei.
The effect of this is that a C-13 nucleus can behave as a little magnet. C-12 nuclei don't have this property.
If we have a compass needle, it normally lines up with the Earth's magnetic field with the north-seeking end pointing north. Provided it isn't sealed in some sort of container, we could twist the needle around with your fingers so that it pointed south - lining it up opposed to the Earth's magnetic field.
It is very unstable opposed to the Earth's field, and as soon as you let it go again, it will flip back to its more stable state.
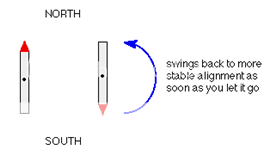
Fig. 1: Allignment in Earth’s Magnetic Field
Because a C-13 nucleus behaves like a little magnet, it means that it can also be aligned with an external magnetic field or opposed to it.
Again, the alignment where it is opposed to the field is less stable (at a higher energy). It is possible to make it flip from the more stable alignment to the less stable one by supplying exactly the right amount of energy.
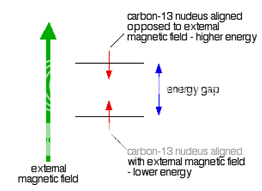
Fig. 2: Carbon 13 nucleus in External Magnetic Field
The energy needed to make this flip depends on the strength of the external magnetic field used, but is usually in the range of energies found in radio waves - at frequencies of about 25 - 100 MHz.
It's possible to detect this interaction between the radio waves of just the right frequency and the carbon-13 nucleus as it flips from one orientation to the other as a peak on a graph. This flipping of the carbon-13 nucleus from one magnetic alignment to the other by the radio waves is known as the resonance condition.5
Among the atoms that, like the protons, give rise to NMR Spectra is one of the isotopes of carbon 13C
The CMR spectrum gives information about the carbon skeleton as
· The number of signals tell us how many different carbons – or different sets of equivalent carbons – there in a molecule
· The splitting of a signal tells us how many hydrogens are attached to each carbon
· The chemical shift tells us the hybridization (sp3, sp2, sp ) of each carbon
· The chemical shift tells us about the electronic environment of each carbon with respect to other, nearby carbon or functional groups7
NOW YOU CAN ALSO PUBLISH YOUR ARTICLE ONLINE.
SUBMIT YOUR ARTICLE/PROJECT AT articles@pharmatutor.org
Subscribe to Pharmatutor Alerts by Email
FIND OUT MORE ARTICLES AT OUR DATABASE
CMR splitting
One of the major practical problems in CMR spectroscopy is the splitting of signals : too much splitting, potentially, and hence spectra that would be too complicated to interpret easily.
Part of the problem is already solved by the low natural abundance of 13C. only occasionally is a 13C near enough to another 13C for 13C-13C spin-spin coupling to occur. As a result CMR spectra do not ordinarily show carbon-carbon splitting and thus enormously simplified ( An equal blessing: proton spectra do not show 13C splitting)
But there remain splitting of 13C signals by protons. In a CMR spectrum we cannot see the absorption by protons because these signals are far off the scale. But splitting of carbon signals by protons: protons on the carbon itself, and on more distant carbon as well
Unwanted splitting is removed by decoupling the 13C spin from that of proton. This decoupling can be done in either of two principle ways, depending upon the frequency of radiation used in the double resonance.7
TMS –THE STANDARD
The zero is where a peak due to the carbon-13 atoms in tetramethylsilane - usually called TMS. Everything else is compared with this.
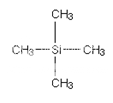
Some NMR spectra show the peak due to TMS (at zero). TMS is chosen as the standard for several reasons. The most important are:
· It has 4 carbon atoms all of which are in exactly the same environment. They are joined to exactly the same things in exactly the same way. That produces a single peak, but it's also a strong peak (because there are lots of carbon atoms all doing the same thing).
· The electrons in the C-Si bonds are closer to the carbons in this compound than in almost any other one. That means that these carbon nuclei are the most shielded from the external magnetic field.
· The net effect of this is that TMS produces a peak on the spectrum at the extreme right-hand side. Almost everything else produces peaks to the left of it.2
Tetramethylsilane, define to be located at δ= 0 ppm as in H1 NMR, absorbs as a quartet(the two outside peaks are barely visible) because of coupling of each carbon to 3 equivalent hydrogen. An upfield quartet δ = 14.2 ppm followed by two triplets at δ 41.4 and 60.6 ppm clearly reveal the resonances for the three of the four carbon atoms of the substituents on the benzene ring. The carbonyl carbon being the most de shielded comes at δ 171.1 ppm3
The chemical shift
The horizontal scale is shown as δ (ppm). δ is called the chemical shift and is measured in parts per million - ppm. The shifts in 13C spectra range over about 240 ppm from TMS about 20 times that of H1 spectra (~12 ppm).
As a result of large range and the sharpness of decoupled peaks, impurities are readily detected and mixtures may be readily analysed. Even stereoisomers that are difficult to analyze by means of H1 spectrometry usually shows discrete 13C peaks.
The chemical shift of given nuclei depends on the relative electron density around the atom. Decreased electron density around an atom deshield the atom from the magnetic field and causes its signal to occur further downfield (higher ppm to the left) in NMR spectrum. Relative higher electron density around an atom shields the atom from magnetic field causes the signal to occur upfield (lower ppm to right) in NMR spectrum. For e.g. carbon atoms that are attached only to carbon and hydrogen atoms are relatively shielded from the magnetic field by density of electrons around them and as a consequence carbon atom of this type produces peaks that are upfield in 13C NMR spectra. On the other hand carbon atom bearing electronegative groups are deshielded from the magnetic field by electron withdrawing effects of these groups and therefore produce peaks that are downfield in the NMR spectrum. Electronegative groups such as halogens, hydroxyl group and other electron withdrawing functional groups deshield the carbon to which they are attached causing their 13C NMR peaks to occur further downfield than those of unsubstituted carbon atoms.
A peak at a chemical shift of, say, 60 means that the carbon atoms which caused that peak need a magnetic field 60 millionths less than the field needed by TMS to produce resonance.
A peak at a chemical shift of 60 is said to be downfield of TMS. The further to the left a peak is, the more downfield it is.
· An NMR spectrum is a plot of the radio frequency applied against absorption.
· A signal in the spectrum is referred to as a resonance.
· The frequency of a signal is known as its chemical shift.
The chemical shift in absolute terms is defined by the frequency of the resonance expressed with reference to a standard compound which is defined to be at 0 ppm. The scale is made more manageable by expressing it in parts per million (ppm) and is indepedent of the spectrometer frequency.

It is often convienient to describe the relative positions of the resonances in an NMR spectrum. For example, a peak at a chemical shift of 10 ppm is said to be downfield or deshielded with respect to a peak at 5 ppm, the peak at 5 ppm is upfield or shielded with respect to the peak at 10 ppm.

Fig. 3: Chemical Shift
Typically for a field strength of 4.7T the resonance frequency of a proton will occur around 200MHz and for a carbon, around 50.4MHz. The reference compound is the same for both, tetramethysilane (Si(CH3)4 often just refered to as TMS).
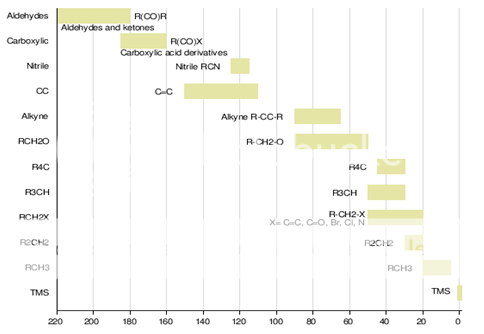
Fig. 4: Chemical shifts of various groups
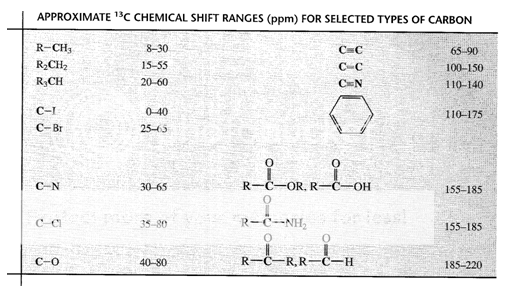
Fig. 5: Chemical shifts of various type of Carbons
Solvents for NMR spectroscopy
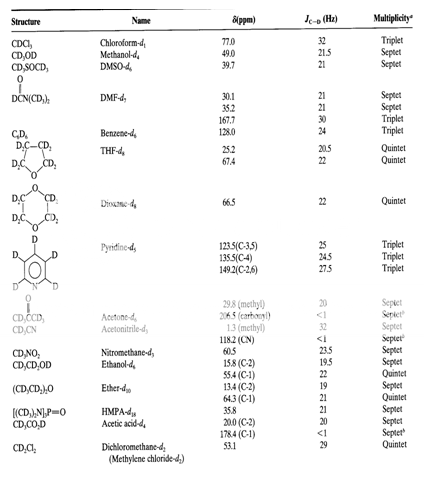
NMR spectra are usually measured using solutions of the substance being investigated. A commonly used solvent is CDCl3. This is a trichloromethane (chloroform) molecule in which the hydrogen has been replaced by its isotope, deuterium.
Table 2 : The 13C Chemical Shifts, Couplings and Multiplicities of Common NMR Solvents2
NOW YOU CAN ALSO PUBLISH YOUR ARTICLE ONLINE.
SUBMIT YOUR ARTICLE/PROJECT AT articles@pharmatutor.org
Subscribe to Pharmatutor Alerts by Email
FIND OUT MORE ARTICLES AT OUR DATABASE
The C-13 NMR spectrum for ethanol
This is a simple example of a C-13 NMR spectrum.
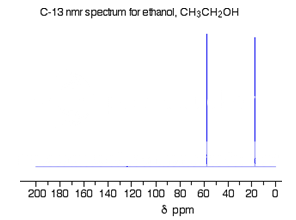
Fig. 6 : C-13 NMR spectrum For Ethanol
There are two peaks because there are two different environments for the carbons.
The carbon in the CH3 group is attached to 3 hydrogens and a carbon. The carbon in the CH2 group is attached to 2 hydrogens, a carbon and an oxygen.
The two lines are in different places in the NMR spectrum because they need different external magnetic fields to bring them in to resonance at a particular radio frequency.
The C-13 NMR spectrum for 1-methylethyl propanoate
This is the C-13 NMR spectrum for 1-methylethyl propanoate (also known as isopropyl propanoate or isopropyl propionate).
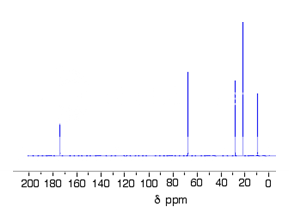
Fig. 7 : C-13 NMR spectrum For 1-methylethyl propanoate
This time there are 5 lines in the spectrum. That means that there must be 5 different environments for the carbon atoms in the compound.

There are 6 carbon atoms. and 5 lines are observed. In this case, two of the carbons are in exactly the same environment. They are attached to exactly the same things.
why the carbon in the CH3 on the left isn't also in the same environment. Just like the ones on the right, the carbon is attached to 3 hydrogens and another carbon. The carbon in the left-hand CH3 group is attached to a carbon atom which in turn is attached to a carbon with two oxygens on it - and so on down the molecule.
That's not exactly the same environment as the carbons in the right-hand CH3 groups. They are attached to a carbon which is attached to a single oxygen - and so on down the molecule.
Each line in a C-13 NMR spectrum recognises a carbon atom in one particular environment in the compound. If two (or more) carbon atoms in a compound have exactly the same environment, they will be represented by a single line.5
REFERENCES
1. Pavia L. Donald, Lampan M Gary, Kriz S.George “Introduction to spectroscopy- A guide for students of organic chemistry” P.No.167,169
2. Silverstein M. Robert, Webster X. Francis “Spectrometric identification of organic compounds” 6th edition, john wiley & sons inc.P.No.217,221,245
3. Kalsi P.S. “Spectroscopy of Organic Compounds” 6th edition published by New age international (P) Limited P.No. 332
4. Solomons Graham T.W., Fryhle B. Craig “ Organic Chemistry”, 9th edition, john wiley & sons inc.P.No.390-393.
5. The background to C-13 NMR spectroscopy Available from URL chemguide .co.uk/analysis/nmr/backgroundc13.html (Accessed on 06-Jan-2011)
6. Chapter13 - C NMR Spectroscopy Available from URL chem.ucalgary. ca/ courses/350/.../ch13-cnmr-1.html (Accessed on 06-Jan-2011)
7. Morrison Thornton Robert, Boyd Neilson Robert “ Organic Chemistry” , 6th edition, Published by Prentice Hall of India Pvt. Ltd., New Delhi P.NO.-629-634
8. Kar Ashutosh “ Pharmaceutical Drug Analysis”, Revised second edition, Published by New Age International (P) Ltd P.No- 347-348
NOW YOU CAN ALSO PUBLISH YOUR ARTICLE ONLINE.
SUBMIT YOUR ARTICLE/PROJECT AT articles@pharmatutor.org
Subscribe to Pharmatutor Alerts by Email
FIND OUT MORE ARTICLES AT OUR DATABASE


