 About Authors: Venkata Suresh Babu Aluri*
Department of pharmaceutical Analysis,
Adhiparasakthi College of Pharmacy,
Melmarvathur, Kancheepuram District, Tamil Nadu - 603319 (INDIA)
Reference ID: PHARMATUTOR-ART-1077
Abstract
A simple, specific, sensitive, rapid, precise and economical high performance liquid chromatography (HPLC) method has been developed for the estimation of Olmesartan medoxomil (OLM) and Atorvastatin calcium (ATC) in tablet dosage form by using acetonitrile- phosphate buffer pH 3.0 (40:60 v/v) as a solvent system. The method was carried out on a Phenomenex Gemini C18 (15 cm x 4.6 mm i.d., 5µm particle size) column, at flow rate 0.9 mL/min. Detection was carried out at 252 nm. The retention time of OLM and ATC was 3.19 and 4.63 min, respectively. The two drugs follow Beer-Lambert’s law over the concentration range of 8 – 40 µg/mL for OLM and 4 – 20 µg/mL for ATC. Validation of proposed method was carried out for its accuracy, precision, specificity and ruggedness according to ICH guidelines. The proposed method can be successfully applied in routine work for the determination of Olmesartan medoxomil and Atorvastatin calcium in combined dosage form.
[adsense:336x280:8701650588]
Introduction
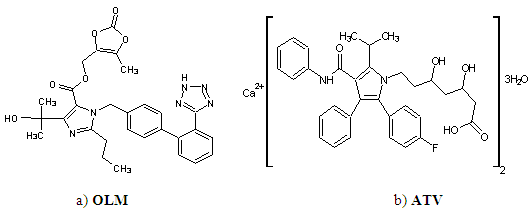
The combination of Olmesartan medoxomil (OLM) and Atorvastatin calcium (ATC) were used for the treatment of co-existing essential hypertension and hyperlipidmia in adult patients. Chemically OLM is Olmesartan medoxomil is (5-methyl-2-oxo1, 3-dioxolen-4-yl) methoxy-4- (1-hydroxy-1-methylethyl) -2-propyl-1- {4- [2- (tetrazol-5-yl) phenyl] phenyl} methyl imidazo-5-carboxylate) .1. OLM is an angiotension ΙΙ receptor antagonist2. ATC is official in IP3. Chemically ATC is [R-(R,R*)] -2- (4-flurophenyl) -β,δ-dihydroxy-5 (1-methylethyl) -3-phenyl-4- [phenylamino) carbonyl] -1H- pyrrole -1-heptanoic acid4. Literature survey reveals that OLM can be estimated by spectrophotometry5, HPLC6,7 and by HPTLC8 methods individually or in combination with other drugs. ATC is reported to be estimated by spectrophotometry9,10 and HPLC11,12 individually or in combination with other drugs. However, there is no analytical method reported for the estimation of OLM and ATC in a combined dosage formulation. Present work describes for the estimation of OLM and ATC in tablet formulation by HPLC method.

Fig. . Chemical structures of (a) Olmesartan medoxomil, (b) Atorvastatin calcium
2. Materials and Methods
2.1. Materials
OLM and ATC were kindly donated by Burgeon pharmaceuticals Ltd., Chennai. Methanol (A.R. Grade, Loba Chem. Pvt. Ltd., Mumbai, India), HPLC grade methanol and acetonitrile (Fisher scientific Mumbai, India) were used.
2.2. Instrument
The Shimadzu (Japan) LC system was equipped with a UV detector. Chromatographic separations were performed using the Phenomenex Gemini(Torrance, USA) C18 column (15 cm x 4.6 mm i.d., 5µm particle size) at 35 0C column oven temperature and analyzed by LC software Win chrome.
2.3. Preparation of Standard Solutions
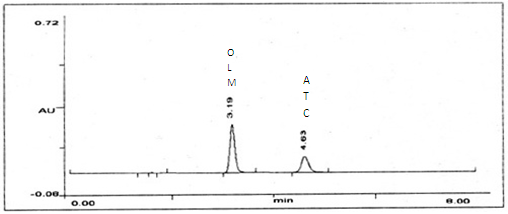
Standard stock solutions of 1000 µg/ml of OLM and ATC were prepared in mixture of acetonitrile: phosphate buffer pH 3.0 (60:40% V/V). The solution containing 10 µg/mL of OLM and 10 µg/mL of ATC were injected and the detection was carried at 252 nm. The retention time of OLM and ATC was 3.19 and 4.63 min, respectively. The chromatogram of OLM and ATC were shown in Fig. 4. The linearity range for OLM is 8-40 µg/mL and for ATC 4-20 µg/mL respectively.
2.4. Assay of Tablet Formulation
Ten tablets were weighed and crushed to obtain fine powder. Accurately weighed quantity of tablet powder equivalent to about 50 mg of OLM was transferred to 50 mL volumetric flask, 30 mL of methanol was added to the flask and sonicated for 15 min. volume was then made up to mark with methanol. The solution was filtered through Whatmann filter paper. The filtrate was appropriately diluted with mobile phase to obtain final concentration of about 16 µg/mL of OLM and 8 µg/mL of ATC. 20 µl of sample solutions were injected into HPLC system for six times, retention time and peak areas were recorded.
3. Method Validation
3.1. Linearity
The methods were validated according to International Conference of Harmonization Q2B guidelines for validation of analytical procedures in order to determine the linearity, precision, accuracy and LOD & LOQ for each analyte. Five point calibration curves were generated with appropriate volumes of working standard solutions. The range was optimized at 8-40 µg/mL for OLM and 4-20 µg/mL for ATC respectively. The linearity was evaluated by least square regression method using a weighed data.
NOW YOU CAN ALSO PUBLISH YOUR ARTICLE ONLINE.
SUBMIT YOUR ARTICLE/PROJECT AT articles@pharmatutor.org
Subscribe to Pharmatutor Job Alerts by Email
3.2. Precision and Accuracy
Both precision and accuracy were determined with standard quality control samples (in addition to calibration standards) prepared in triplicates at different concentration levels covering the entire linearity range. Precision is the degree of repeatability of analytical method under normal operational conditions. The precision of the assay was determined by repeatability (intra-day) and intermediate precision (inter-day) and reported as %R.S.D.
Accuracy is the percent of analyte recovered by assay from a known added amount. Data from nine determinations over three concentration levels covering the specified range was determined. The repeatability of the method was determined by assaying six sample solutions of the test concentration.
3.3. LOD and LOQ
The limit of detection (LOD) is defined as the lowest concentration of an analyte that an analytical process can reliably different from background levels. The limit of quantification (LOQ) is defined as the lowest concentration of the standard curve that can be measured with acceptable accuracy, precision and variability. The LOD and LOQ were calculated as LOD= 3.3s/S and LOQ = 10s/S
Where‘s’ is the standard deviation of lowest standard concentration and ‘S’ is the slope of the standard curve.
4. Results and Discussion
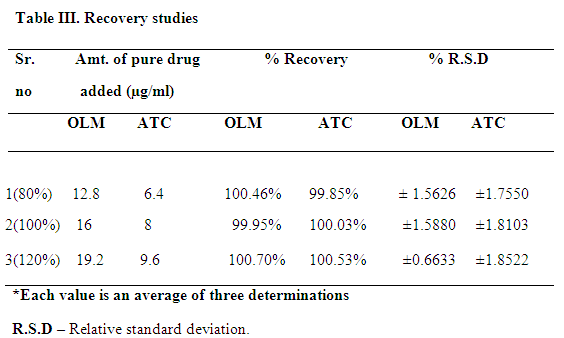
A RP-HPLC method was developed for OLM and ATC, which can be conveniently employed for routine quality control in pharmaceutical dosage forms. The chromatographic conditions were optimized in order to provide a good performance of assay. The mobile phase for each drug was selected based on its polarity. A mobile phase composed of acetonitrile-phosphate buffer (60:40 V/V, pH 3.0) is selected. The retention times of OLM and ATC were 3.19 and 4.63 min, respectively. The total run time was short for the two drugs. The chromatogram was shown in Fig. ?. The method is specific as none of the excipients interfered with the analytes of interest. All the validation parameters of the two drugs were shown to be within the specified limits (Table ?). Percent label claim for the OLM and ATC in the tablet analysis was found in the range of 99.72 % to 101.66 % (Table ??). Accuracy of the proposed method is ascertained by recovery studies and the results are expressed as % recovery. Percent recovery for OLM and ATC was found in the range of 99.95 % to 100.53 % (Table ???), values of the standard deviation and % R.S.D was satisfactorily low, indicating the accuracy of the method. Intra-day and inter-day precision studies were carried out by analyzing the tablet powder at different time interval on same day and on three different days, respectively. Standard deviation and % R.S.D of intra-day and inter-day precision was found to be less than 2 indicating precision of proposed method. Based on result obtained, it found that the proposed method is accurate, precise, reproducible and economical and can be employed for routine quality control of OLM and ATC in combined tablet formulation.

Fig. ?. Typical chromatograms showing the elution of OLM and ATC
Table ?. Validation parameters of the OLM and ATC for the proposed method
| Method characteristics | OLM | ATC |
| Linear range (µg mL-1) | 8-40 | 4-20 |
| Correlation coefficient | 0.9997 | 0.9997 |
| Standard deviation | 0.8199 | 1.2479 |
| Theoretical plates | 5841 | 5666 |
| Asymmetry | 1.29 | 1.02 |
| Capacity | 1.26 | 1.96 |
| Tailing factor | 1.21 | 1.05 |
| Accuracy (%) | 99.95 | 99.85 |
| LOD (µg mL-1) | 0.108 | 0.267 |
| LOQ (µg mL-1) | 0.571 | 0.842 |
Table ??. Tablet analysis by HPLC
|
Labelled amount (mg per dose) |
Amount found (mg per dose) |
Percantge obtaind | % R.S.D |
| OLM-20 mg | 20.15 | 100.75% | ± 0.8107 |
| ATC-10 mg | 10.08 | 100.80% | ± 0.9021 |
*Each value is an average of six determinations
Table ???. Recovery studies

5. Acknowledgements
The authors are very thankful to burgeon pharmaceutical Ltd., Chennai for the gift samples of Olmesartan medoxomil and Atorvastatin calcium. authors are thankful to Prof. (Dr.) T. Vetrichelvan , M.Pharm., Ph.D., Principal and Head, department of pharmaceutical analysis, Adhiparaskthi college of pharmacy for providing necessary facilities and encouragement.
References
1) The Merck index, 14th ed., published by Merck Research lab, Merck and co. Inc., Whitehouse station, NJ, USA, 2006, 6839.
2) Martindale, 34th ed., the complete drug reference, published by Pharmaceutical press, Publications division of the royal pharmaceutical society of Great Britain, 2008, 975.
3) Indian pharmacopoeia 2007, Volume Ι, published by the controller of publication, Ghaziabad, 751.
4) The Merck index, 14th ed., published by Merck Research lab, Merck and co. Inc., Whitehouse station, NJ, USA, 2006, 864.
5) Celebier M, Altinoz S, Determination of Olmesartan medoxomil in tablets by UV spectroscopy, Govi-verlag journal, 10(6), 2007, 419-22.
6) Ritesh N. Sharma, Syam S, RP-HPLC-DAD method for determination of Olmesartan medoxomil in bulk and tablets exposed to forced conditions, Acta Parma, 60(1), 2010, 13-24.
7) Nilesh jain, Ruchi Jain, Jithendra Banweer, Deepak Kumar Jain, Development and validation of RP-HPLC method for the determination of Amlodipine besylate and Olmesartan medoxomil in their combined tablet formulation, International journal of current pharmaceutical research, 26(5), 2010, 40-43.
8) Jain. N, Raghuwanshi R. and Deepthi Jain, Development and validation of RP-HPLC method for simultaneous estimation of Atorvastatin calcium and Fenofibrate in tablet dosage form, Indian journal of pharmaceutical sciences, 70(2), 2008, 263-265.
9) Bharat G. chaudary, Ashok B. Patel, Simultaneous spectrophotometric estimation of Atorvastatin calcium and Amlodipine besylate in tablet dosage form, International journal of chemtech research, 2(1), 2010, 633-639.
10) Karajgi S. R, Simultaneous estimation of Atorvastatin and Ramipril by first order derivative spectrophotometric method, Journal of pharmacy research, 2(5), 2009, 874-77.
11) Altuntas T. G, Krk b N, Liquid chromatographic determination of Atorvastatin in bulk drug, tablet and human plasma, Journal of liquid chromatography, 27(1), 2001, 83-93
12) Shah. N. J, Development and validation of a simultaneous HPTLC method for the estimation of Olmesartan medoxomil and Hydrochlorothiazide in tablet dosage form, Indian journal of pharmaceutical sciences, 69(4), 2007, 834-36.
NOW YOU CAN ALSO PUBLISH YOUR ARTICLE ONLINE.
SUBMIT YOUR ARTICLE/PROJECT AT articles@pharmatutor.org


