{ DOWNLOAD AS PDF }
ABOUT AUTHORS
DANDU GIRIJA, *AKKIMI PADMA, A.TIRUPATHIREDDY, BASU VENKATESWARA REDDY
Sankar Reddy Institute of Pharmaceutical sciences, Salakalveedu, Bestavaripeta, Prakasam, Andha pradesh, India.
ABSTRACT
The present research work was broadly focused on the estimation of in Lacidipine in bulk and pharmaceutical dosage form by using two UV spectrophotometric methods like Zero order spectroscopy (Method-1), and first order derivative spectroscopy (Method-2). The solvent employed for the two methods was methanol and absorption maximum was found to be 284nm, and 277nm respectively. The developed methods showed linearity sin the range between 20-100µg/ml. The correlation co-efficient was ≥ 0.999. The precision (%RSD) for all the two methods was found to be ≤2. The accuracy was performed by spiking standard drug at 50,100 and 150% of the test concentration and the values obtained were within the limits. The assay for the formulation was found to be within limits. All the results were satisfactory the developed methods were linear, accurate, reproducible and robust.
Reference Id: PHARMATUTOR-ART-2654
|
PharmaTutor (Print-ISSN: 2394 - 6679; e-ISSN: 2347 - 7881) Volume 7, Issue 03 Received On: 16/02/2019; Accepted On: 21/02/2019; Published On: 01/03/2019 How to cite this article: Dandu, G., Akkimi, P., Reddy, A. and Reddy, B.V. 2019. Estimation of Lacidipine in Bulk and Pharmaceutical Dosage Form by Zero Order, and First Order Derivative UV Spectrophotometric Methods. PharmaTutor. 7, 3 (Mar. 2019), 73-78. DOI:https://doi.org/10.29161/PT.v7.i3.2019.73 |
INTRODUCTION
Lacidipine is a calcium channel blocker drug. Lacidipine is a highly vascular selective newer dihydro pyridines suitable for once daily administration. It is claimed to attain higher concentration in vascular smooth muscle membrane; approved only for use as anti-hypertensive. Calcium channel blockers can be safely given to patients with obstructive lung disease and peripheral vascular disease in whom β-blockers are contraindicated. The problem of rebound worsening of angina on withdrawal after chronic use is less with calcium channel blockers than with β-blockers. Lacidipine is used effectively in Angina pectoris, Hypertension, Cardiac arrhythmias and Cardiomyopathy (Foster A.2001).
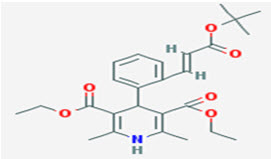
Fig: 1 Structure of Lacidipine
MATERIAL AND METHODS
Instruments used:
UV Visible double beam Spectrophotometer (UV 1800) of Lab India, Japan was used in the study connected to system and operated with UV probe as data handling system. A digital analytical balance (VIBRA) was used in the study.
Materials used:
API of lacidipine was procured as a gift sample by Aurbindo Pharma Limited (Hyderabad, India). Distilled water was prepared using Milli Q system in laboratory. Formulation of lacidipine was purchased from local pharmacy.
Methods
Method 1: Zero order UV spectroscopy
The analytical wavelength was selected by preparing a solution of known concentration (µg/ml). The solution was scanned in the wavelength range of 200-400nm with blank. Then normal UV absorption spectrum was obtained (Chatwal, 2000)
Method 2: First order derivative UV spectroscopy
It involves the conversion of normal spectrum into first derivative spectrum. These derivative spectra have narrow spectral band width. Because of this resolution is better and it reveals overlapping bands that were lost in original spectra. Thus it is advantageous for selection of accurate wavelength. In addition, concentration measurements of an analyte in the presence of interference or of two or more analytes in a mixture can sometimes be made more easily or more accurately using derivative methods (David Harvey 1997).
METHOD DEVELOPMENT
Selection of solvent:
Solubility of analyte selection of various Solvents like Water, methanol, 50% Ethanol, was employed for recording of the UV spectrum and for the optimization of the method. Solubility was found to be methanol.
Preparation of Stock solution:
Lacidipine 10 mg was weighed and transferred to a 10 ml volumetric flask and dissolved in distilled water. It was dissolved properly and diluted up to the mark with diluent to obtain final concentration of 1000 μg/ml. optimized solution was prepared from the stock solution with distilled methanol, which was used as working standard.
Calibration curve of lacidipine
Aliquots of solutions 2-10 ml were taken from the standard stock solution in to 10ml volumetric flasks. The volume was made up to 10 ml using methanol to obtain the concentrations of 20, 40, 60, 80, and 100 (mcg/ml) (Method 1, and 2). The absorbance was measured at 284 nm, 277nm, against a blank as methanol. The linearity curve for zero order and first order were plotted was given in Figure 3 and 5.
Method Validation
Linearity:
The linearity of an analytical procedure is its ability (within a given range) to obtain test results which are directly proportional to the concentration (amount) of the analyte in the sample.
Range:
Range is the difference between upper concentration and lower concentration. The results obtained are within the range.
Precision:
The precision of an analytical procedure expresses the closeness of agreement between a series of measurements from multiple sampling of the same homogeneous sample under prescribed conditions. The concentration of 10μg/ml, 40μg/ml, and 60μg/ml were selected for precision. They are prepared by taking 0.1ml, 0.4ml, 0.6ml from stock solution-1 respectively into the 10ml volumetric flask and made up to the mark with water and was analyzed by using UV spectrophotometer.
Accuracy:
To determine the accuracy of the proposed method different levels of drug concentrations were prepared from independent stock solutions and analyzed. To provide an additional support to the accuracy of the developed assay method, a standard addition method was employed, which involved the addition of different concentrations of pure drug to a known pre-analyzed dilution of the pure drug and the total concentration was determined using the proposed method. The % recovery levels of the added sample drug were, calculated. The recovery studies were performed at different levels like 50%, 100% and 150% of the target concentration. The amount of standard drug recovered from the spiked test samples was calculated from the absorbance values. Percentage recovery was showed in table III.
Assay Procedure
Twenty tablets were weighed and finely powdered. The powder equivalent to 10 mg of Lacidipine was weighed and transferred into volumetric flask of 100ml capacity containing 25 ml of methanol and sonicated for 30 min. The flask was shaken and volume was made up to the mark with methanol to obtain a solution of 100μg/ml. The solution was filtered through Whatmann filter paper (No. 41) and used for the estimation.
Assay Calculation
The quantity of Lacidipine was calculated from calibration curve using absorbance value of test formulation.
RESULTS AND DISCUSSION
Linearity and range:
In two methods Lacidipine showed good linearity in the range of 20-100μg/ml. The correlation coefficient was found to be 0.999. The linearity data was shown in table II and figure 2 & 4
Precision (Repeatability):
Both intra-day and inter-day precision was within the acceptable limit with a % RSD less than 2%. So, the developed methods were more precise and repeatable.
Accuracy:
The recovery studies with standard addition method at 50%, 100% and 150% levels of the test concentration showed good results with a mean recovery of two methods 101% and99.1 %.The developed method was accurate. The results were shown in table III and IV
Ruggedness:
The ruggedness of an analytical method is degree of reproducibility of test results obtained by the analysis of the same samples under a variety of normal test conditions, such as different laboratories, different analysts, different instruments, different lots of reagents, different elapsed assay times, different assay temperatures and different days, etc. The results of Lacidipine were shown in table V and VI.
Table II: Linearity of Lacidipine
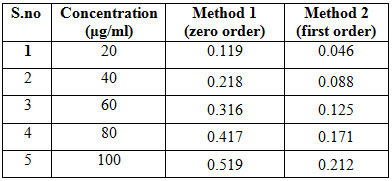

Fig. 2: Overlay spectra of zero order UV spectroscopy
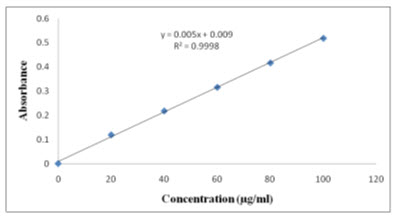
Fig. 3: Linearity graph of Zero Order UV-Spectroscopy
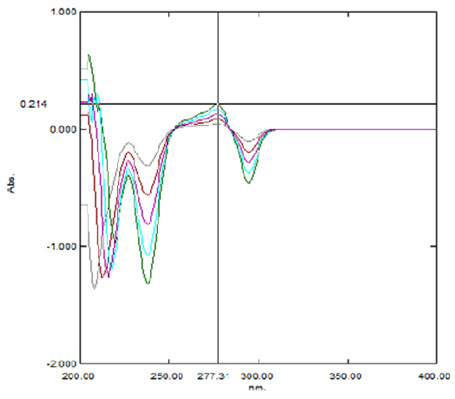
Fig .4: Overlay spectra of first order derivative UV spectroscopy

Fig .5: Linearity graph of First Order derivative UV-Spectroscopy
Table III: Accuracy results for Lacidipine by Zero order derivative spectroscopy
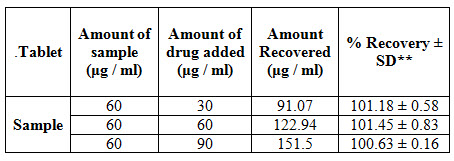
Table IV: Accuracy results for Lacidipine by First order derivative spectroscopy

Table V: Ruggedness results for Lacidipine by Zero order derivative spectroscopy

Table VI: Ruggedness results for Lacidipine by First order derivative spectroscopy

The overall summary of optical characteristics and other validation parameters of zero order and first order derivative spectroscopic methods were shown in table VII.
Table VII: Validation parameters of lacidipine in Zero order and first order UV spectroscopy methods

CONCLUSION
The proposed study describes novel UV spectrophotometric methods for the estimation of lacidipine in bulk and pharmaceutical dosage form using suitable diluent. The method was validated and found to be simple, selective, accurate, reproducible and precise when compared to other methods. Percentage of recovery shows that the method is free from interference of the excipients used in the formulation. The method is also cost effective with respect to solvent consumption. Therefore, the proposed methods can be used for routine analysis of lacidipine its dosage form.
REFERENCES
1. Beckett AH, Stenlake JB. (1997); Practical Pharmaceutical Chemistry; 4th Ed. CBS Publishers and Distributors ; New Delhi
2. Chatwal, Anand (2000); Instrumental Methods of Chemicals Analysis ; 1st ed. Himalaya Publishing House; Mumbai
3. David Harvey (1997); Modern Analytical Chemistry 1st ed; Harcourt Brace & Company; United States of America
4. Day RA, Underwood AL (1986); Quantitative Analysis; 4th Ed. Prentice Hall New Delhi
5. Elhance DN. (2003); Fundamentals of statistics; Kitabmahal
6. Foster A, Hempenstall J, Tucker I, Rades T (2001); Selection of excipients for melt extrusion with two poorly water-soluble drugs by solubility parameter calculation and thermal analysis. Int J Pharm; 226(1-2); 147-161.
7. http://en.wikipedia.org/wiki/Lacidipine.
8. http://www Elchem.kaist.ac.kr/vt/chem.-ed/sep/lc/hplc.htm.
9. http://www.drugs.com/international/lacidipine.html
10. Nozal Maria J, Bernal Jose L, Jimenez Juan J, Martin Maria T, Diez Francisco J (2004); Development and validation of a liquid chromatographic method for determination of Lacidipine residues in surfaces in the manufacturer of Pharmaceuticals. J Chromatogr ; 1024(1); 115-122.
11. Ravi Sankar S. (2001); Text book of pharmaceutical analysis; 3rd ed. Rx Publications; Tirunelveli
12. Scott RPW, Simpson CF, Kadz ED. (1924); Tandem techniques; John Wileyand Sons, Inc; New York
13. Sharma BK (2000); Instrumental Methods of Chemical Analysis 13th ed; Goel Publisher House; Meerut
14. Willard HH, Merrit LL, Dean JA, Settle FA. Jr. (1989); Instrumental Methods of Analysis. 6th Ed. CBS Publishers and Distributors ; New Delhi
15.Yuri Kazakevich, Rosario Lobrutto. (2007); HPLC for pharmaceutical scientists; A John Wiley and Sons, Inc ; Publication United States of America
NOW YOU CAN ALSO PUBLISH YOUR ARTICLE ONLINE.
SUBMIT YOUR ARTICLE/PROJECT AT editor-in-chief@pharmatutor.org
Subscribe to Pharmatutor Alerts by Email
FIND OUT MORE ARTICLES AT OUR DATABASE


