ABOUT AUTHORS:
R.B.Desireddy, *Sure.Lakshmi Sindhuri, A. Charitha, G.Naga sowjanya
Nalanda institute of pharmaceutical sciences,
kantepudi, Sattenapalli.
*suresindhuri@gmail.com
ABSTRACT:
The scope and need of the present work is to develop and validate an analytical method for the analysis of an anti-diabetic drug. Literature survey reveals various UV, HPLC and LC/MS methods are available for individual estimation of the Metformin Hydrochloride and Sitagliptin Phosphate and in combination with other drugs. But, none of the reported analytical methods describe a stability indicating RP-HPLC method for the simultaneous analysis of Metformin and Sitagliptin in tablet dosage form. Hence the present works aims at developing a simple, sensitive, precise, economic and validated second order derivative UV spectroscopic method & stability indicating RP-HPLC method for the simultaneous estimation of Sitagliptin and Metformin in pharmaceutical dosage form. Incomparision with direct UV method, the second order derivative UV spectroscopic method eliminates the interference from UV-absorbing excipients. This method was found to be fast and can be used for formulation screening. HPLC is an integral analytical tool in assessing drug product stability. HPLC methods should be able to separate, detect and quantify the various drug-related degradants that can form on storage or manufacturing, plus detect and quantify any drug-related impurities that may be introduced during synthesis. Stability studies were carried out under various stress conditions like acid hydrolysis, base hydrolysis, water hydrolysis, oxidation, photolytic degradation and under UV-light. Both the drugs Sitagliptin and metformin were degraded more in the alkaline condition.
REFERENCE ID: PHARMATUTOR-ART-1912
INTRODUCTION
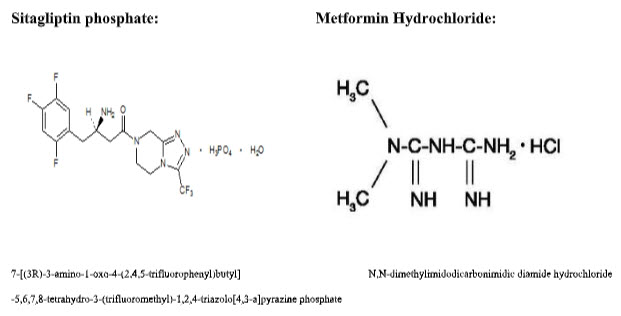
Sitagliptin Phosphate and Metformin Hydrochloride are available in combined dosage forms as film coated tablets (JANUMET). Each tablet contains 50mg of Sitagliptin Phosphate and 500 mg of Metformin Hydrochloride. It is used for the treatment of Diabetes Mellitus. Sitagliptin which belongs to class triazolopyrazines(phenylethylamines) works competitively to inhibit the enzyme dipeptidyl peptidase 4 (DPP-4)[1-2]. This enzyme breaks down the incretins GLP-1(Glucagon like particle-1) and they have the ability to potentiate the secretion of insulin and suppress the release of glucagon from pancreas.
Metformin is an oral anti-diabetic first line drug for treating type II diabetes. It is a biguanide drug activates AMP-activated Protein kinase (AMPK), a liver enzyme that plays an important role in Insulin signaling,[3-5] whole body energy balance and the metabolism of glucose and fats. It improves hyperglycemia by suppressing “hepatic gluconeogenesis”.
The combination of Metformin and a dipeptidyl peptidase 4 inhibitor (Sitagliptin) has been shown to be safe, effective and well-tolerated treatment for type II diabetes. When both these drugs are combinedly administered the mean HbA1C levels are reduced by 0.65-1.1% from a baseline of 7.8-8.4%.
According to an FDA guidance document, a stability-indicating method is “a validated[16] quantitative analytical procedure that can detect the changes with time in the pertinent properties of the drug substance and drug product. A stability-indicating method[17] accurately measures the active ingredients, without interference from degradation products, process impurities, excipients or other potential impurities. High performance liquid chromatography (HPLC) is an integral analytical tool in assessing drug product stability. HPLC methods should be able to separate, detect and quantify the various drug-related degradants that can form on storage or manufacturing, plus detect and quantify any drug-related impurities that may be introduced during synthesis.
Reagents and materials
All the chemicals and solvents used are of analytical grade which were purchased from Qualigens, Merk & S.D Fine chemicals, Mumbai. Both the drug samples of Sitagliptin Phosphate and Metformin Hydrochloride were received as a gift samples. Commercially available JANUMET tablets were purchased from local market. Each tablet consists of 500mg of Metformin Hydrochloride (MET) and 50mg of Sitagliptin phosphate(STG).
Instrumentation:
Schimadzu Digital Electronic Balance - BL 220H, Labindia SAB 5000 pH meter, Value Vaccum pump, Schimadzu UV-1800, UV/Vis-Spectrophotometer, Schimadzu HPLC, Phenomenex column, UV detector, Ultrasonic cleaner, Life care equipments pvt.ltd.
Procedure:
U.V Spectrophotometric method for simultaneous estimation of Sitagliptin phosphate & Metformin hydrochloride by second order derivative spectroscopy:
In derivative spectral method [6-8], firstly UV spectrum of drug would be recorded at 200-400 nm and processed to get derivative spectrum. At the zero crossing point of one drug, the second drug would be measured which gives a reasonable means of estimating drug without interference of additives or impurities and thereby improves the sensitivity of the method. Thus a derivative spectrum shows better resolution of overlapping bands than the fundamental spectrum and may permit the accurate determination of the lmax of the individual bands.
SOLVENT SELECTION:
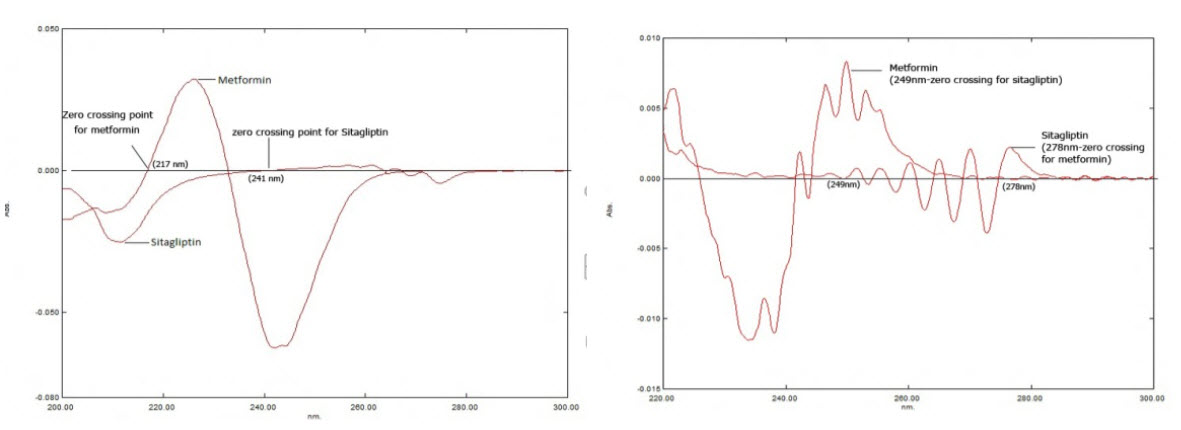
The UV spectra of Sitagliptin Phosphate (STG) and Metformin Hydrochloride(MET) were recorded individually in various solvents like water, methanol, acetonitrile, ethanol etc. All the spectra were processed to obtain derivative spectra. The derivative spectra of STG and MET in solvents like methanol, acetonitrile showed no favorable zero crossing points i.e., at any particular wavelength where one drug has zero crossing point, the other drug also have similar zero crossing point hence no spectral isolation was found. When dissolved in water, the derivative spectra of both drugs, STG and MET showed zero crossing point in 1st and 2nd derivative spectra (Fig: 1, 2). The zero crossing points and their absorbance are shown in table 1.
Though both first and second derivative spectra showed zero crossing points and their absorbances were considerably better, 2nd derivative spectra was selected because the spectral characteristics were good in this particular derivative spectra and it obeys Beer Lambert's Law. The zero crossing points of Sitagliptin Phosphate in water were found to be 249, 252 and 257nm and 272, 278 and 280 for Metformin Hydrochloride.
Out of this 249nm and 278nm have been selected for the present study based on its linearity data. At 249nm Sitagliptin Phosphate showed zero absorbance but Metformin Hydrochloride had considerable absorbance. Similarly at 278nm, Metformin Hydrochloride showed zero absorbance but Sitagliptin Phosphate had considerable absorbance.
Table:1. Zero crossing points of Sitagliptin (STG) & Metformin (MET)
|
Type of Derivative |
Drug |
Zero crossing point (nm) |
|
Ist |
STG |
241nm |
|
MET |
217nm |
|
|
2nd |
STG |
249nm |
|
MET |
278nm |
Preparation of standard solutions:
Standard stock solutions of Sitagliptin Phosphate and Metformin Hydrochloride were prepared by dissolving 10 mg (1000 mg/ml) of the each drug in water and the volume was made up to 100ml in standard flasks separately. Further dilution was done to get 100 mg/ml solution. From the 100 mg/ml solution, 0.5 to 5ml were taken and made up to 10 ml with water to get concentrations ranging from 5 to 50mg/ml. Normal spectra obtained were processed to get 2nd derivative spectra. The 2nd derivative overlain spectra of STG & MET are shown in Fig.2.
Preparation of sample solution:
Twenty tablets (JANUMET) were accurately weighed & the average weight was calculated. The tablets were crushed into fine powder & a quantity equivalent to 10 mg of drug was dissolved in water and to it 9mg of standard Sitagliptin Phosphate was added (standard addition method), so that the sample contains 10mg each of Sitagliptin Phosphate and Metformin Hydrochloride. Finally the volume was made up to get a working concentration of 10mg/ml each of Sitagliptin Phosphate and Metformin Hydrochloride. The normal spectra obtained were processed to get 2nd derivative spectra which are shown in Fig.3. The 2nd derivative UV absorbances were noted at 249nm and 278 nm and concentrations of Sitagliptin Phosphate and Metformin Hydrochloride were determined from the respective calibration curves. The percentage label claim and estimated amount are shown in table 2.
Table: 2. Result of Analysis of formulation
|
Drug |
Labeled amount (mg/tablet) |
Estimated Amount (mg/tablet) |
% label claim |
% RSD* |
|
Sitagliptin Phosphate |
50 |
49.12 |
98.24 |
0.31 |
|
Metformin Hydrochloride |
500 |
502.6 |
100.52 |
0.47 |
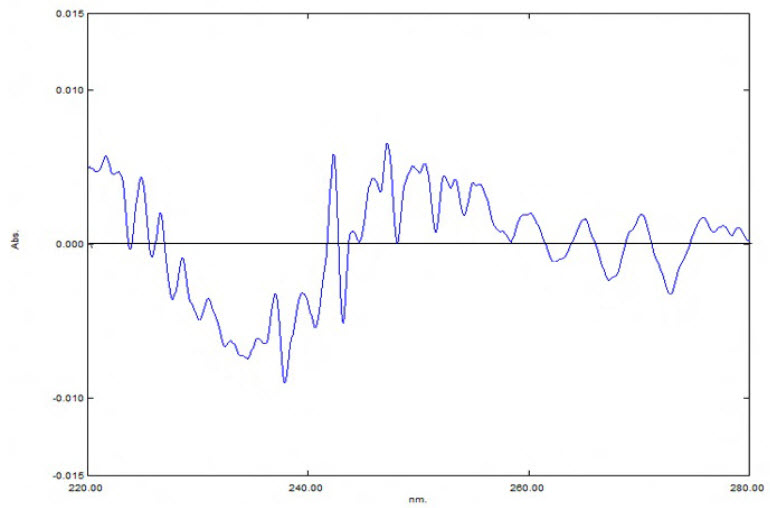
Fig: 3.2nd order derivative spectrum of formulation (Sitagliptin Phosphate10µg/ml and Metformin Hydrochloride 10µg/ml)
VALIDATION OF U.V METHOD [16]:
1. LINEARITY: Sitagliptin Phosphate & Metformin Hydrochloride were found to be linear in the concentration ranging from 5-50mg/ml. The calibration curve was plotted with the 2nd order derivative UV absorbance Vs concentration as shown in Figs.4&5 .The slope, intercept and correlation coefficient values were found to be 0.0002, 0.0001 and 0.998, respectively for STG, 0.0001, 0.000 and 0.998, respectively for MET.
Table:3 Calibration data of Sitagliptin Phosphate(STG)& Metformin Hydrochloride(MET).
|
S. No |
Concentration (mg/ml) |
Absorbance of STG |
Absorbance of MET |
|
1 |
5 |
0.00164 |
0.00038 |
|
2 |
10 |
0.00341 |
0.00074 |
|
3 |
15 |
0.00472 |
0.00126 |
|
4 |
20 |
0.00614 |
0.00165 |
|
5 |
25 |
0.00818 |
0.00205 |
|
6 |
30 |
0.00971 |
0.00244 |
|
7 |
35 |
0.0113 |
0.00291 |
|
8 |
40 |
0.01254 |
0.00317 |
|
9 |
45 |
0.01420 |
0.00370 |
|
10 |
50 |
0.01545 |
0.00407 |

Fig: 4 & 5. 2nd order derivative calibration graph of Sitagliptan & Metformin respectively.
2. PRECISION: Precision studies were performed by preparing the standards three times and measuring the 2nd derivative UV absorbance of the recorded derivative spectra. The % RSD was calculated. Low RSD values indicate that the method is précis
Table: 4.Intraday Precision Data
|
Concentration |
Absorbances |
RSD |
||
|
Sitagliptin |
Metformin |
Sitagliptin |
Metformin |
|
|
278nm |
249nm |
278nm |
249nm |
|
|
25µg/ml |
0.00812 |
0.00201 |
1.2 |
0.87 |
|
0.00801 |
0.00206 |
|||
|
0.00821 |
0.00212 |
|||
|
30µg/ml |
0.00972 |
0.00245 |
0.99 |
0.89 |
|
0.00965 |
0.00244 |
|||
|
0.00969 |
0.00236 |
|||
*RSD of three observations
Table: 5.Inter day Precision Data
|
Concentration |
Absorbances |
RSD |
||
|
Sitagliptin |
Metformin |
Sitagliptin |
Metformin |
|
|
278nm |
249nm |
278nm |
249nm |
|
|
25µg/ml |
0.00812 |
0.00201 |
1.2 |
0.87 |
|
0.00801 |
0.00206 |
|||
|
0.00821 |
0.00212 |
|||
|
30µg/ml |
0.00972 |
0.00245 |
0.99 |
0.89 |
|
0.00965 |
0.00244 |
|||
|
0.00969 |
0.00236 |
|||
3. ACCURACY (Recovery studies)
In order to ensure the suitability and reliability of proposed method, recovery studies were carried out. The recovery studies were done to confirm the accuracy of the method. To an equivalent quantity of formulation powder (10mg), 9mg of standard Sitagliptin Phosphate was added to the formulation powder (standard addition method), a known standard quantity of Sitagliptin Phosphate and Metformin Hydrochloride were added at 50% and 100% levels. Then, the mixed sample were analysed by proposed method. The percentage recovery and % RSD were calculated.
Table: 6. Recovery Data of 2nd derivative Spectroscopic Method
|
Drug |
% level |
% Recovery |
% RSD* |
|
Sitagliptin Phosphate |
50 |
99.1 |
0.41 |
|
100 |
98.21 |
0.46 |
|
|
Metformin Hydrochloride |
50 |
102.6 |
0.32 |
|
100 |
102.4 |
0.43 |
Development and validation of stability indicating RP-HPLC method for the simultaneous estimation of Sitagliptin phosphate and Metformin hydrochloride in pharmaceutical dosage form:
Reverse phase chromatographic technique was selected since both drugs are polar in nature.
Selection of wavelength: Sensitivity of HPLC [9-15] method that uses ultraviolet (UV) detector depends upon the proper selection of wavelength. An ideal wavelength is the one that gives maximum absorbance and good response for the drug detected at lower concentration also. From the UV spectra obtained for both drugs, 254nm was selected as the wavelength for this study.
OPTIMIZATION OF SEPARATION CONDITION:
Effect of strength of triethylamine: Different ionic strengths of triethylamine such as 0.05, 0.1, 0.2, 0.5% v/v etc., adjusted to pH 3.5 in the ratio of 70:30 (different ionic strengths of acetonitrile : triethylamine) were tried & shown in Fig: 6&7. Among these solutions, 0.1% triethylamine : acetonitrile in the ratio of 70:30 % v/v showed symmetrical peaks where as the other strengths showed peak tailing. Hence 0.1% v/v was selected as the ideal strength of triethylamine.
Effect of strength of Triethylamine

Effect of pH: Keeping other conditions constant, chromatograms were recorded with different pH such as 5, 4.5, 4, 3.5,3 etc, adjusted using 1% orthophosphoric acid shown in Fig. 8&9. At the pH 4 the chromatogram shows tailing but at pH 3.5 the peak shapes of both drugs were good and hence selected for further study.

CHROMATOGRAPHIC CONDITIONS:
Stationary Phase: Phenomenex C18 Column, 100A (250X4.6mm, 5µ)
Mobile phase: 0.1% Triethylamine: Acetonitrile
(Triethylamine buffer pH – 3.5, adjusted with orthophosphoricacid)
Solvent ratio: 70:30% v/v (0.1% Triethylamine pH 3.5: Acetonitrile)
Detection wavelength: 254 nm
Flow rate: 1.0 ml/min
Operating pressure: 152 kgf
Operating temperature: Room temperature
Preparation of Standard Solution:
Stock solutions containing concentrations of 1000µg/ml of Sitagliptin Phosphate and 1000 µg/ml of Metformin Hydrochloride were prepared using mobile phase. This solution was suitably diluted to get aliquots of standard solutions containing 10 to 100µg/ml of Sitagliptin Phosphate and 5 to50µg/ml of Metformin Hydrochloride.
Preparation of Sample Solution : Twenty tablets (JANUMET) were accurately weighed & the average weight was calculated. The tablets were crushed into fine powder & a quantity equivalent to 10 mg of drug was dissolved in mobile phase and to it 9mg of standard Sitagliptin Phosphate was added (standard addition method), such that sample contains 10mg each of Sitagliptin Phosphate and Metformin Hydrochloride. Finally the volume was made upto get a working concentration of 30µg/ml each of Sitagliptin Phosphate and Metformin Hydrochloride shown in Fig:10.
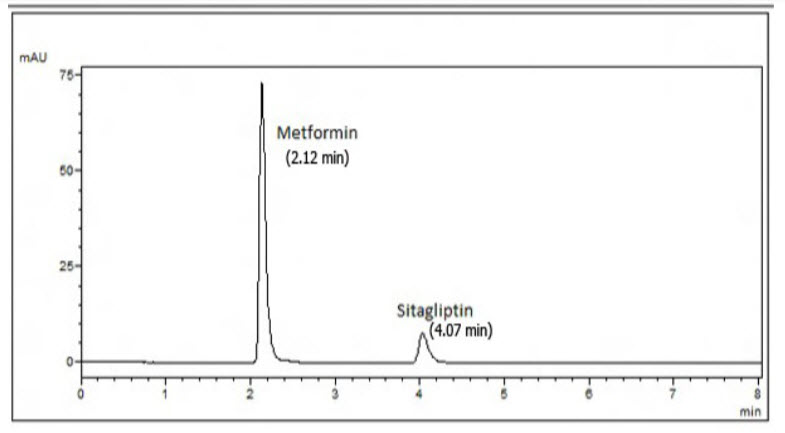
Fig: 10 chromatogram of MET and STG in pharmaceutical formulation
VALIDATION OF RP – HPLC METHOD [16]
1. Limit of Detection (LOD) and Limit of Quantification (LOQ): LOD and LOQ of Sitagliptin Phosphate and Metformin Hydrochloride were calculated mathematically .
LOD = 3.3 X SD/S
LOQ = 10 X SD/S
Where SD is the standard deviation of response (peak area) and S is the average of the slope of the calibration curve. The LOD of Sitagliptin Phosphate and Metformin Hydrochloride was found to be 0.4µg/ml and 0.251µg/ml. The LOQ of Sitagliptin Phosphate and Metformin Hydrochloride was found to be 0.90µg/ml and 0.6µg/ml respectively.
2. Linearity and Range: Sitagliptin Phosphate and Metformin Hydrochloride were found to be linear in the range of 10 to100 µg/ml and 5 to 50µg/ml. Calibration graphs were plotted using peak areas of standard drugs VSconcentration of standard solutions, Fig.11& 12. The slope, intercept and correlation coefficient values were found to be 1449, 22710 and 0.998 respectively, for Sitagliptin Phosphate and 15979, 11183 and 0.998 respectively, for Metformin Hydrochloride.
Table: 7. Calibration data of Sitagliptin (STG) & Metformin(MET) by RP-HPLC
|
S.no |
STG Concentration(µg/ml) |
STG Peak area |
MET Concentration(µg/ml) |
MET Peak area |
|
1 |
10 |
38401 |
5 |
99502 |
|
2 |
20 |
52379 |
10 |
16,2284 |
|
3 |
30 |
68094 |
15 |
253006 |
|
4 |
40 |
77728 |
20 |
343391 |
|
5 |
50 |
92910 |
25 |
399974 |
|
6 |
60 |
109295 |
30 |
476311 |
|
7 |
70 |
123888 |
35 |
576136 |
|
8 |
80 |
140914 |
40 |
653562 |
|
9 |
90 |
150989 |
45 |
71,9981 |
|
10 |
100 |
169810 |
50 |
821874 |
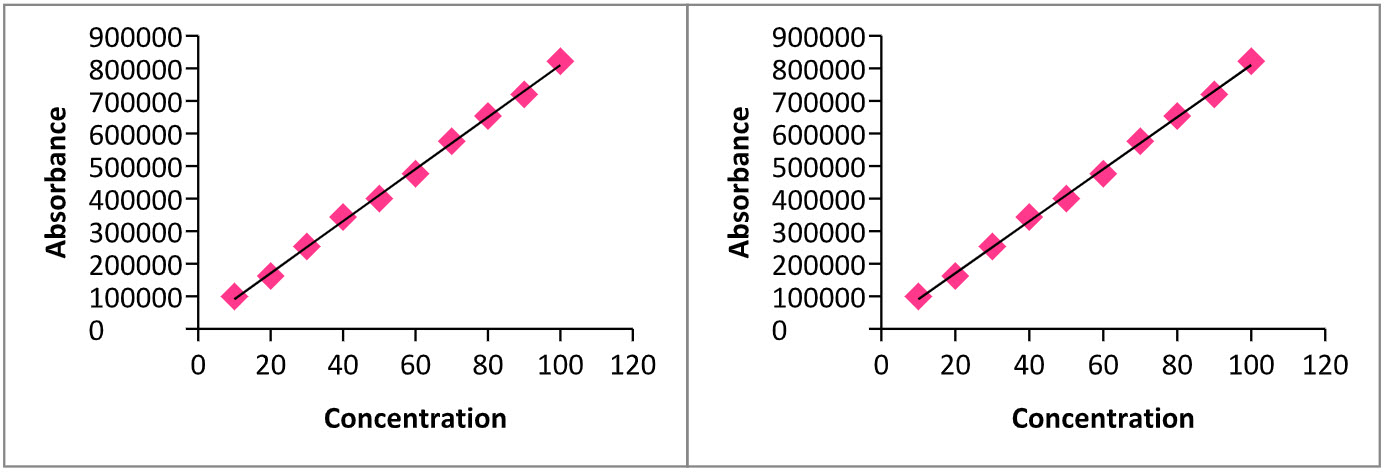
Fig: 11&12. Calibration curves of Sitagliptan & Metformin by RP-HPLC.
3. Precision: Precision of method was demonstrated by
- Intraday precision
- Inter day precision
- Repeatability of injection
a. Intra day precision
Intraday precision was found out by carrying out analysis of standard drug solutions at two different concentrations in the linearity range for three times on the same day and % RSD was calculated & results were shown in Table: 8
Table: 8. Intraday Precision
|
Level |
Concentration (µg/ml) |
Peak Area |
RSD |
|||
|
STG |
MET |
STG |
MET |
STG |
MET |
|
|
1
|
50 |
25 |
90926 |
399671 |
0.555 |
1.185 |
|
91342 |
397321 |
|||||
|
91937 |
406476 |
|||||
|
2 |
60 |
30 |
109296 |
469322 |
0.585 |
1.058 |
|
109694 |
467411 |
|||||
|
107441 |
459996 |
|||||
b. Inter day precision
Inter day precision was found out by carrying out analysis of standard drug solutions at two different concentrations in the linearity range for three days over a period of one week and % RSD was calculated & results were shown in Table: 9.
Table: 9. Inter day precision
|
Level |
Concentration (µg/ml) |
Peak Area |
RSD |
|||
|
STG |
MET |
STG |
MET |
STG |
MET |
|
|
1 |
50 |
25 |
90072 |
386422 |
0.927 |
0.7 |
|
2 |
90694 |
381436 |
||||
|
3 |
91740 |
385774 |
||||
|
1 |
60 |
30 |
99947 |
459436 |
0.356 |
0.297 |
|
2 |
99297 |
467344 |
||||
|
3 |
99872 |
459913 |
||||
STG- Sitagliptin, MET- Metformin
Repeatability of Injection
A standard stock solution of the mixture of drugs was prepared and injected 6 times, the precision and percentage of RSD was calculated & results were shown in Table: 10.
Table: 10. Repeatability of Injection
|
Concentration (µg/ml) |
Injection |
Peak Area |
RSD |
||
|
STG |
MET |
STG |
MET |
||
|
40 |
1 |
77692 |
653559 |
0.377 |
0.542 |
|
2 |
77294 |
652761 |
|||
|
3 |
77196 |
659971 |
|||
|
4 |
77743 |
652241 |
|||
|
5 |
77849 |
659775 |
|||
|
6 |
77886 |
657622 |
|||
STG- Sitagliptin, MET- Metformin
Accuracy (recovery studies):
To study the reliability, suitability and accuracy of the method, recovery studies were carried out. To an equivalent quantity of formulation powder (10mg), 9mg of standard Sitagliptin Phosphate was added to it (standard addition method), so that sample contains 10mg each of Sitagliptin Phosphate and Metformin Hydrochloride. Then a known quantity of standard Sitagliptin Phosphate and Metformin Hydrochloride were added to 50% and 100% level extracted with mobile phase and made upto mark with same. This solution was further diluted. The concentration of drugs present in resulting solution was determined using assay method and percentage recovery and % RSD were calculated & results were shown in Table: 11.
Table: 11. Recovery Studies
|
Drug |
% Recovery |
% RSD* |
||
|
50% level |
100% level |
50% level |
100% level |
|
|
Sitagliptin Phosphate |
98.7 |
98.6 |
0.23 |
0.31 |
|
Metformin Hydrochloride |
101.73 |
101.4 |
0.41 |
0.29 |
* RSD of three Observations
Robustness: the optimized conditions such as change in mobile phase & slight variation in pH i.e., ± 2% in ratio of acetonitrile in mobile phase, ± 0.2 units in pH of buffer. The response factors for these changed chromatographic parameters were almost same as that of the fixed chromatographic parameters and hence developed method is said to be robust as shown in Fig.6&7, Fig.8&9 .
System Suitability Studies
The system suitability studies were carried out as specified in USP. These parameters include column efficiency, resolution, peak asymmetry factor, capacity factors, peak tailing factor and percentage co-efficient of variation for peak area on height of repeatable injection.Although USP requires only two of these criteria for method validation, parameters like column efficiency (N), capacity factor (k) and peak asymmetry factor (As).
Table: 12. System Suitability Studies
|
Drug |
Rs |
N |
k |
a |
As |
Tailing |
|
Sitagliptin Phosphate |
1.9 |
5951.54 |
0.6 |
4.16 |
1.21 |
1.3 |
|
Metformin Hydrochloride |
3568.372 |
2.5 |
1.30 |
1.02 |
STABILITY STUDIES
Stability studies were performed on Sitagliptin Phosphate and Metformin Hydrochloride to prove the stability indicating property of the method. The stress conditions employed for degradation study includes light exposure, acid hydrolysis (0.1N Hcl), base hydrolysis (0.1N NaoH), water hydrolysis, oxidation (1% hydrogen peroxide), and UV light exposure. The duration of time selected for degradation studies [17] was 6 hours. The photolytic degradation was performed by exposing the solid drugs to sunlight for 6 hours. The solution containing the concentration of 100 µg/ml of each of Sitagliptin Phosphate and Metformin Hydrochloride were prepared using respective solvents (NaoH, Hcl, water and Hydrogen peroxide) separately. For each hour solution containing final concentration of 40µg/ml of Sitagliptin and 5µg/ml Metformin were prepared from the above mentioned stock solutions using the mobile phase and analyzed in the HPLC. The %degradation of both the drugs was calculated and the degradation patterns were much more prominent in alkali hydrolysis & the results shown in the Fig :13 & table : 13.
Table: 13. RESULTS OF STABILITY INDICATING STUDIES FOR SITAGLIPTIN & METFORMIN RESPECTIVELY
|
Conditions |
Amount found (µg/ml) |
% Degraded |
||||||
|
Duration of time in hours |
||||||||
|
0 hr |
1 hr |
2hr |
3 hr |
4hr |
5hr |
6 hr |
||
|
Water (60˚c,6hrs) |
99.89 99.89 |
98.91 99.10 |
98.77 98.16 |
98.62 98.14 |
97.67 97.76 |
97.40 97.74 |
97.01 96.97 |
2.99 3.01 |
|
0.1% Hcl (60˚c,6hrs) |
99.81 99.80 |
99.29 98.64
|
98.71 96.13 |
98.64 95.96 |
98.41 95.91 |
97.81 94.94 |
96.94 94.93 |
3.06 5.07 |
|
0.1%NaoH (60˚c,6hrs) |
98.97 98.91 |
95.53 98.91
|
92.67 97.19 |
91.10 91.94 |
87.06 87.68 |
84.44 83.27 |
79.14 76.33
|
20.86 23.67 |
|
1% H2O2 (6 hrs) |
99.91 99.91 |
99.74 99.88 |
99.72 99.87 |
99.61 99.19 |
98.99 98.76 |
98.73 98.39 |
98.01 97.91 |
1.99 2.09 |
|
UV light (6 hrs) |
99.91 99.82 |
99.86 99.73 |
99.84 99.42 |
99.67 99.126 |
99.21 98.96 |
99.09 98.94 |
98.94 98.94 |
1.06 1.06 |
|
Sunlight (6 hrs) |
99.95 99.89 |
- |
- |
- |
- |
- |
97.99 98.24 |
2.01 1.76 |
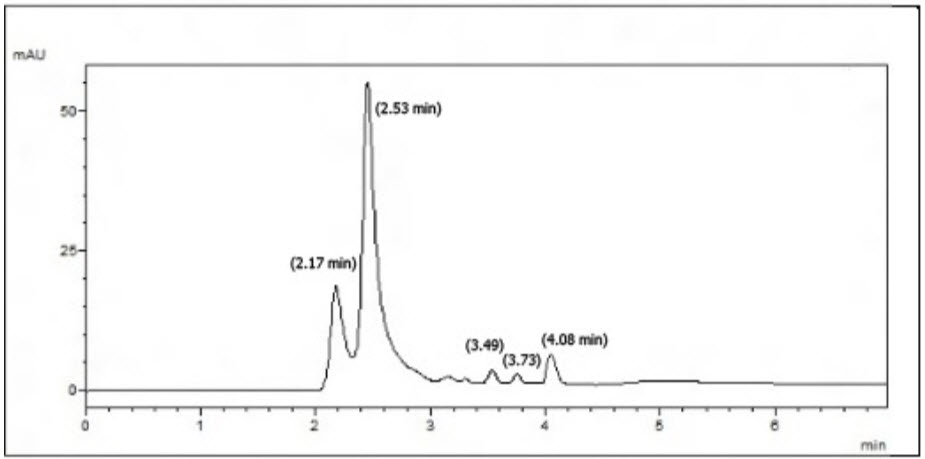
Fig.13: Chromatogram of mixture of Metformin and Sitagliptin degraded with 0.1N NaoH at 6th hour.
RESULTS AND DISCUSSION
UV SPECTOSCOPIC METHOD: A second order UV derivative spectroscopic method was developed for the determination of Sitagliptin Phosphate and Metformin Hydrochloride in tablet dosage form. In this method, second derivative spectra of Sitagliptin and Metformin were recorded in water. From the spectra, 249nm and 278nm were selected as the zero crossing points. At 249nm Sitagliptin showed zero absorbance but Metformin had the considerable absorbance. Similarly Metformin had no absorbance but Sitagliptin had a considerable absorbance. A calibration curve was plotted for both Sitagliptin and metformin in the concentration range of 5 to 50µg/ml. The slope, intercept and correlation coefficient values were found to be 0.000082, 0.000018 and 0.998 for Sitagliptin and 0.00031, 0.00016 and 0.998 for Metformin respectively. The formulation was extracted, diluted and spectra was recorded and processed to get derivative spectrum. The 2nd derivative UV absorbances were noted and the amounts were calculated.
HPLC METHOD: The retention times of Sitagliptin and Metformin were found to be 4.08 and 2.13 minutes respectively.The developed method was validated as per ICH guidelines. Calibration graphs were potted using standard peak areas vs. concentration of standard solutions. The slope, intercept and correlation coefficient values were found to be 1449, 22710 and 0.998 for Metformin respectively. Sitagliptin was found to be linear in the range of 10 to 100µg/ml and Metformin was found to be linear in the range of 5 to 50µg/ml. The LOD of Sitagliptin and Metformin were found to be 0.4µg/ml and 0.251µg/ml respectively. The LOQ of Sitagliptin and Metformin were found to be 0.90µg/ml and 0.6µg/ml respectively. Precision of the developed method was studied under intraday precision, interday precision and repeatability of the injection. Low % RSD values indicate that the method is precise. The developed method was found to be robust. System suitability parameters like number of theoretical plates (N), Peak asymmetry factor (As), Capacity factor (K), selectivity factor (α) and Resolution (Rs) were studied. Stability studies were carried out under various stress conditions like acid hydrolysis, base hydrolysis, water hydrolysis, oxidation, photolytic degradation and under UV-light. Both the drugs Sitagliptin and metformin were degraded more in the alkaline condition.
SUMMARY AND CONCLUSION
The direct UV method development for the simultaneous analysis of Sitagliptin and metformin can be applied for the routine analysis of formulation. Incomparision with direct UV method, the second order derivative UV spectroscopic method eliminates the interference from UV-absorbing excipients. This method was found to be fast and can be used for formulation screening.
The developed RP-HPLC method offers simplicity, selectivity, precision and accuracy. In this proposed method symmetrical peaks with good resolution were obtained. Out of all the methods developed, the RP-HPLC method was more sensitive and precise. However, both of these methods can be used for the simultaneous analysis of Sitagliptin and Metformin in formulation.
References:
1. Beconi MG, et.al, Disposition of the dipeptidyl peptidase 4 inhibitor Sitagliptin in rats and dogs, Drug Metabolism and Disposition, 200;35: 525–532.
2. Ramakrishna N, et.al, Sensitive liquid chromatography tandem mass spectrometry method for the quantification of Sitagliptin, a DPP-4 inhibitor, in human plasma using liquid liquid extraction, Biomedical Chromatography, 2008;22: 214–222.
3. Amruta B. Loni, Minal R. Ghante, S. D. Sawant. Simultaneous UV Spectrophotometric Method for Estimation of Sitagliptinphosphate and Metformin hydrochloride in Bulk and Tablet Dosage Form ,Scholars Research Library Der Pharma Chemica, 2012, 4 (3): 854-859.
4. Swales IG, et al., Simultaneous quantitation of Metformin and Sitagliptin from mouse and human desorption tandem mass spectrometry. Journal of Pharmaceutical Biomedical Analysis, 2011;55(3) 544-551.
5. Govindasamy Jeyabalan , Narendra Nyola . Simultaneous estimation of sitagliptin phosphate monohydrate and metformin hydrochloride in bulk and pharmaceutical formulationby RP-HPLC, J Pharm Educ Res,2012 ;3( 2).
6. Patel P, Patel S, Patel. UV. Spectrophotometric Method for Simultaneous Estimation of Eperisone Hydrochloride and Diclofenac Sodium in Synthetic Mixture. International Resea J Pharma 2012; 3(9):203-206.
7. Patel S, Hariyani K. Spectrophotometric Estimation of Tolperisone Hydrochloride and Diclofenac Sodium In Synthetic Mixture by Q-Absorbance Ratio Method. Amer J Pharmtech Resea 2012;2(5):833-841.
8. P. C. Bhamare et al., A New Analytical Method Development and Validation of Metformin Hydrochloride and Fenofibrate by Absorbance Ratio UV Spectrophotometric Method, Asian Journal of Biochemical and Pharmaceutical Research, 2011;1(2):115-128.
9. Aryane M.S, et al., Development and validation of RP-HPLC method for the analysis of Metformin. Asian Journal of pharmaceutical sciences, 2006;19(3): 231-235.
10. Bhanu R, Kulkarni S, Kadam A. Simultaneous estimation of Gliclazide and Metformin in pharmaceutical dosage by reverse phase HPLC, Indian Drugs, 2006;43(1): 16-20.
11. Sahoo PK, Sharma R and Chaturvedi SC. Simultaneous estimation of Metformin Hydrochloride and Pioglitazone Hydrochloride by RP-HPLC method from combined tablet dosage form, Indian Journal of Pharmaceutical Sciences, 2008;70(3): 383-386.
12. Yuen KH, Peh KK. Simple HPLC method for the determination of Metformin in human plasma, Journal of chromatography.B, 1998; 710(1-2); 243-246.
13. Khan, Agrawal Y P, Sabarwal N, Jain A, Gupta A K. Simultaneous Estimation of Metformin and Sitagliptin In tablet dosage form. Asian J Biochem Pharma Res 2011; 1(2):352-358.
14. Ravi PP, Sastry BS, Rajendra PY, Appala RN. Simultaneous Estimation of Metformin HCl and Sitagliptin Phosphate in tablet dosage forms by RP-HPLC. Res J Pharm Tech 2011;4(4): 646-649.
15. Lakshmi KS, Rajesh T,Sharma S. Simultaneous determination of metformin and pioglitazone by reversed phase HPLC in pharmaceutical dosage forms. Int J Pharm Pharm Sci 2009;1(2): 162-166.
16. The International Conference on Harmonization, Q2 (R1), Validation of Analytical Procedure, Text and Methodology, 2005.
17. Ramzia I, et al., Spectroflourometric and spectro-photometric methods for the determination of Sitagliptin in binary mixture with Metformin and ternary mixture with Metformin and Sitagliptin degradation product. International Journal of Biomedical Sciences, 2011; 7(1): 62-69.


