About Author:
Sowjanya.G
M.pharmacy II year
Annamacharya college of pharmacy,
Rajampet, kadapa dist, a.p, india
Sowji.ces@gmail.com
INTRODUCTION TO DISSOLUTION
A. DEFINITION1
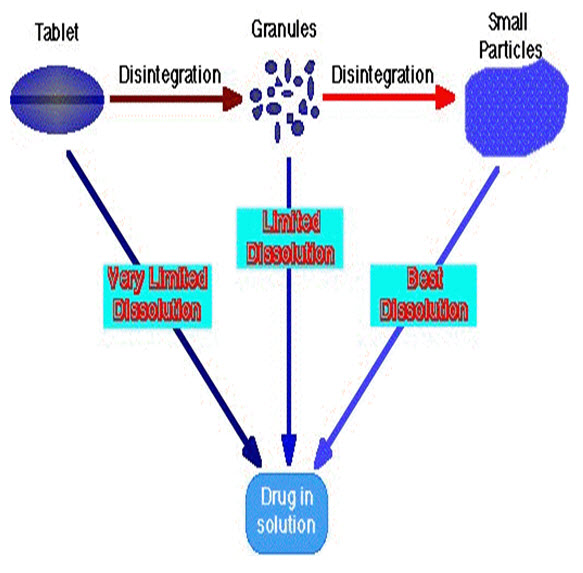
"Dissolution is defined as the process by which solid substances enters in solvent to yield a solution. Stated simply, dissolution is the process by which a solid substance dissolves. Fundamentally, it is controlled by the affinity between the solid substance and the solvent.. "The physical characteristics of the dosage form, the wettability of the dosage unit, the penetration ability of the dissolution medium , the swelling process, the disintegration and the deaggregation of the dosage forms are few of the factors that influence the dissolution characteristics of drugs.
Drug dissolution testing is a quantitative analytical technique for assessing drug release from pharmaceutical products, in particular solid oral dosage forms such as tablets and capsules. The reason for conducting the test is that generally for a drug to be absorbed, usually from the gastrointestinal tract, the drug should be in solution form. Thus evaluation of dissolution becomes useful and necessary.
There is ample evidence in the literature to indicate that drug dissolution is critical for drug absorption into the systemic circulation (“bloodstream”) or human body in general. In this respect, one may consider a dissolution test as a surrogate marker of availability of drug for systemic circulation. Commonly, this availability of drug in the body is known as bioavailability and is defined as, the rate and extent of absorption of a drug into the systemic circulation. The rate and extent of drug absorption are generally represented by maximum observed concentration (Cmax) of a drug in blood and area under the drug concentration verses time curve (AUC), respectively. In general, drug dissolution results are compared to these in vivo parameters.
REFERENCE ID: PHARMATUTOR-ART-1666
B. LAWS GOVERNING DISSOLUTION1
The rate of dissolution is described by
1. NOYES-WHITNEY EQUATION
dW DA ( Cs - C )
----- = ------------
dt L
Where:
dW
-----
dt is the rate of dissolution.
A is the surface area of the solid.
C is the concentration of the solid in the bulk dissolution medium.
Cs is the concentration of the solid in the diffusion layer surrounding the solid.
D is the diffusion coefficient.
L is the diffusion layer thickness.
As can be inferred by the Noyes-Whitney equation, the rate of dissolution may be modified primarily by altering the surface area of the solid. The surface area may be adjusted by altering the particle size. The rate of dissolution may also be altered by choosing a suitable polymorph of a compound. Specifically, crystalline forms dissolve slower than amorphous forms. Also, coatings on a tablet or a pellet may act as a barrier to reduce the rate of dissolution. Coating may also be used to modify where dissolution takes place.
2. FICK’S FIRST LAW
Fick's first law of diffusion states
Rate of solution = D . A . (Cs-Cb)/h
Where
D is the diffusion coefficient,
A the surface area,
Cs the solubility of the drug,
Cb the concentration of drug in the bulk solution, and
h the thickness of the stagnant layer.
If Cb is much greater than Cs then we have so-called "Sink Conditions" and the equation reduces to
Rate of solution = D . A . (Cs/h
Surface area, A
The surface area per gram (or per dose) of a solid drug can be changed by altering the particle size. Methods of particle size reduction include mortar and pestle, mechanical grinders, fluid energy mills, solid dispersions in readily soluble materials (PEG's).
Diffusion layer thickness, h
This thickness is determined by the agitation in the bulk solution. In vivo we usually have very little control over this parameter. It is important though when we perform in vitro dissolution studies because we have to control the agitation rate so that we get similar results in vitro as we would in vivo.
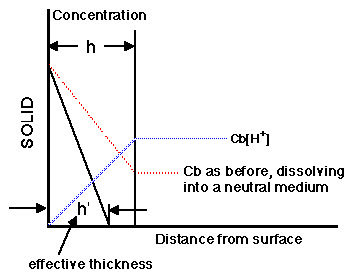
Plot of Concentration versus Distance for Dissolution into a Reactive Medium
The apparent thickness of the stagnant layer can be reduced when the drug dissolves into a reactive medium. For example, with a weakly basic drug in an acidic medium, the drug will react (ionize) with the diffusing proton (H+) and this will result in an effective decrease in the thickness of the stagnant layer.
The effective thickness is now h' not h. Also the bulk concentration of the drug is effectively zero. For this reason weak bases will dissolve more quickly in the stomach.
Diffusion coefficient, D
The value of D depends on the size of the molecule and the viscosity of the dissolution medium. Increasing the viscosity will decrease the diffusion coefficient and thus the dissolution rate. This could be used to produce a sustained release effect by including a larger proportion of something like sucrose or acacia in a tablet formulation.
Drug solubility, Cs
Solubility is another determinant of dissolution rate. As Cs increases so does the dissolution rate. We can now look at ways of changing the solubility of a drug.
C. THEORIES OF DISSOLUTION1
Several theories to explain drug dissolution have been proposed. Some of the important ones are
(i) The Diffusion layer model / Film Theory
This model assumes that a layer of liquid, H cm thick, adjacent to the solid surface remains stagnant as the bulk liquid passes over the surface with a certain velocity. The reaction at the solid/liquid interface is assumed to be instantaneous forming a saturated solution, C s , of the solid in the static liquid film. The rate of dissolution is governed entirely by the diffusion of the solid molecules from the static liquid film to the bulk liquid according to Fick’s first law:
J = - Df dc / dx
Where
J is the amount of substance passing perpendicularly through a unit surface area per time,
Df ,is the diffusion coefficient and dc / dx, is the concentration gradient.
After a time t, the concentration between the limit of the static liquid layer and the bulk liquid becomes C t . Once the solid molecules pass into the bulk liquid, it is assumed that there is rapid mixing and the concentration gradient disappears.
The theory predicts that if the concentration gradient is always constant i. e. C s - C t is constant because C s >> C t (“sink” conditions which usually mean C s > 10 C t ) then a uniform rate of dissolution is obtained.
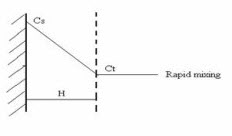
Diffusion Layer Model
(ii) The Interfacial Barrier Model / Double Barrier / Limited Solvation Theory
In the interfacial barrier model , it is assumed that the reaction at the solid/liquid interface is not instantaneous due to a high activation free energy barrier which has to be surmounted before the solid can dissolve. Thereafter the dissolution mechanism is essentially the same as in above, with the concentration at the limit of the static layer of liquid becoming C t after time t.
The rate of diffusion in the static layer is relatively fast in comparison with the surmounting of the energy barrier, which therefore becomes rate limiting in the dissolution process.
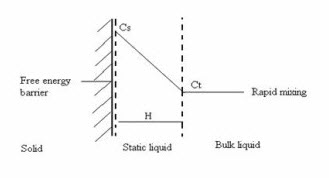
Diagrammatic representation of the free energy barrier to dissolution
(iii) The Danckwert’s Model / Penetration / Surface Renewal Theory
The Danckwert’s model assumes that macroscopic packets of solvent reach the solid/liquid interface by eddy diffusion in some random fashion.
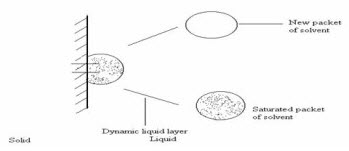
Danckwert’s Model.
At the interface, the packet is able to absorb solute according to the laws of diffusion and is then replaced by a new packet of solvent. This surface renewal process is related to the solute transport rate and hence to the dissolution rate.
The rate laws predicted by the different mechanisms both alone and in combination, have been discussed by Higuchi . However, the earliest equation expressing dissolution rate in a quantitative manner was proposed by Noyes and Whitney as:-
dc / dt = k (C s - C t )
where
dc / dt is the rate of change in concentration with respect to time, and k is the rate constant.
The integrated form of the equation is:
In [C s / (C s - C t ) ] = kt
The equation in resemblance to the other rate law equations , predicts a first order dependence on the concentration gradient (i.e. C s - C t ) between the static liquid layer next to the solid surface and the bulk liquid. Noyes and Whitney explained their dissolution data using a concept similar to that used for the diffusion model. This considerations relate to conditions in which there is no change in the shape of the solid during the dissolution process (i.e. the surface area remains constant). However, for pharmaceutical tablets, disintegration occurs during the dissolution process and the surface area generated therefore varies with time.
D. DISSOLUTION APPARATUS1
The ideal features of a dissolution apparatus are:
1. Simple in design, easy to operate and usable under a variety of conditions.
2. Fabrication dimensions and positioning of all components are precisely specified and reproducible, run-to-run.
3. Provides an easy way of introducing the dosage form into the dissolution medium and once immersed, holding it in a regular and reliable fashion.
4. Permits controlled variable intensity of mild, uniform, non-turbulent liquid agitation.
5. Provides minimum mechanical abrasion to the dosage form during the test period to avoid disruption of the microenvironment surrounding the dissolving form.
6. Maintains nearly perfect sink conditions.
7. Prevents / eliminates evaporation of the dissolution medium and maintains it at a fixed temperature within a specified narrow range. Most apparatuses are thermostatically controlled at around 37o C.
8. Ease of drawing samples for automatic or manual analysis with out interrupting the flow characteristics of the liquid.
9. Facilitates good inter-laboratory agreement.
10. Sensitive enough to reveal process changes and formulation differences but still yield repeatable results under identical conditions.
11. Permits evaluation of disintegrating, non-disintegrating, dense or floating tablets or capsules, and finely powdered drugs.
The dissolution apparatus has evolved gradually and considerably from a simple beaker type to a highly versatile and fully automated instrument.
The devices can be classified in a number of ways. Based on the absence or presence of sink conditions, there are two principal types of dissolution apparatuses:
1. Closed-compartment apparatus:It is basically a limited-volume apparatus operating under non-sink conditions. The dissolution fluid is restrained to the size of the container, e.g. beaker type apparatuses such as the rotating basket and the rotating paddle apparatus.
2. Open-compartment (continuous flow-through) apparatus:It is the one in which the dosage form is contained in a column which is brought in continuous contact with fresh, flowing dissolution medium (perfect sink condition).
A third type called as dialysis systems are used for very poorly aqueous soluble drugs for which maintenance of sink conditions would otherwise require large volume of dissolution fluid. Only the official or compendial methods (USP methods) will be discussed here briefly.
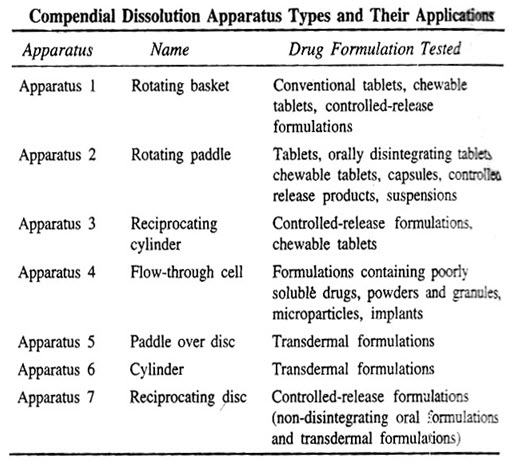
Rotating Basket Apparatus (USP Apparatus 1 / IP Apparatus 2) :First described by Pernarowski et al, it is basically a closed-compartment, beaker type apparatus comprising of a cylindrical glass vessel with hemispherical bottom of one litre capacity partially immersed in a water bath to maintain the temperature at 37o C. A cylindrical basket made of 22 mesh to hold the dosage form is located centrally in the vessel at a distance of 2 cm from the bottom and rotated by a variable speed motor through a shaft . The basket should remain in motion during drawing of samples. All metal parts like basket and shaft are made of SS 316.
Rotating Paddle Apparatus (IP Apparatus 1 / USP Apparatus 2):The assembly is same as that for apparatus 1 except that the rotating basket is replaced with a paddle which acts as a stirrer. The method was first described by Levy and Hayes. The dosage form is allowed to sink to the bottom of the vessel. Sinkers are recommended to prevent floating of capsules and other floatable forms. A small, loose, wire helix may be attached to such preparations to prevent them from floating.
Reciprocating Cylinder Apparatus (USP Apparatus 3): This apparatus consists of a set of cylindrical flat-bottomed glass vessels equipped with reciprocating cylinders. The apparatus is particularly used for dissolution testing of controlled-release bead-type (pellet) formulations.
Flow-Through Cell Apparatus (USP Apparatus 4): The flow-through apparatus consists of reservoir for the dissolution medium and a pump that forces dissolution medium through the cell holding the test sample.
It may be used in either :
· Closed-mode where the fluid is recirculated and, by necessity, is of fixed volume, or
· Open-mode when there is continuous replenishment of the fluids.
The material under test (tablet, capsules, or granules) is placed in the vertically mounted dissolution cell, which permits fresh solvent to be pumped in (between 240 and 960 ml/h) from the bottom.
Advantages of this apparatus include –
1. Ease of maintaining of sink conditions during dissolution which is often required for drugs having limited aqueous solubility.
2. Feasibility of using large volume of dissolution fluid.
3. Feasibility for automation of apparatus.
Paddle over Disc Apparatus (USP Apparatus 5): This apparatus is used for evaluation of transdermal products and consists of a sample holder or disc that holds the product. The disc is placed at the bottom of apparatus 2 and the apparatus operated in the usual way.
Cylinder Apparatus (USP Apparatus 6): This apparatus is also used for evaluation of transdermal products and is similar to apparatus 1. Instead of basket, a stainless steel cylinder is used to hold the sample. The sample is mounted on an inert porous cellulosic material and adhered to the cylinder.
Reciprocating Disc Apparatus (USP Apparatus 7): This apparatus is used for evaluation of transdermal products as well as non-disintegrating controlled-release oral preparations. The samples are placed on disc-shaped holders using inert porous cellulosic support which reciprocates vertically by means of a drive inside a glass container containing dissolution medium. The test is carried out at 32oC and reciprocating frequency of 30 cycles/min.
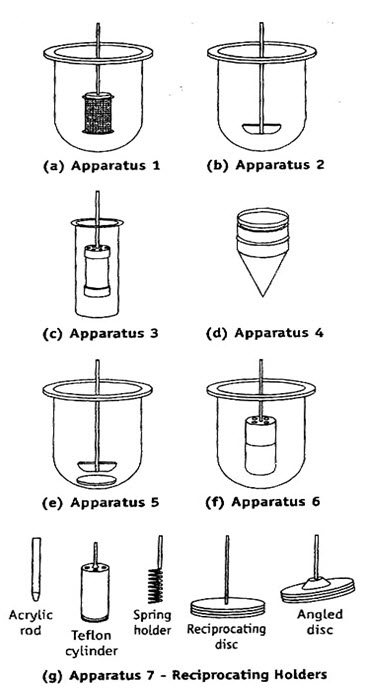
Schematic representation of dissolution apparatus – (a) USP Apparatus 1 / IP Apparatus 2 – rotating basket apparatus, (b) IP Apparatus 1 / USP Apparatus 2 – Rotating paddle apparatus, (c) USP Apparatus 3 – reciprocating cylinder apparatus,(d) USP Apparatus 4 – flow through cell apparatus, (e) USP Apparatus 5 – Paddle over disc apparatus, (f) USP Apparatus 6 – cylinder apparatus, and (g) USP Apparatus 7 – reciprocating disc apparatus.
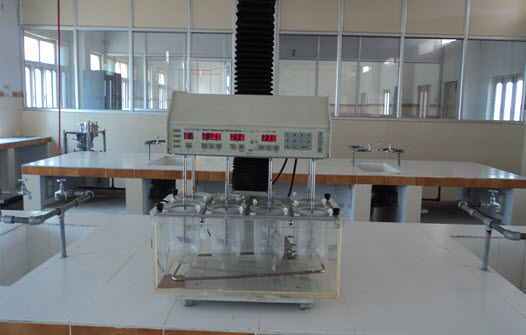
Tablet dissolution tester (Electro lab TDT-06P)
E. FACTORS AFFECTING DISSOLUTION1,2
There are several factors that must be considered in the design of dissolution test. They are –
1. Factors relating to the dissolution apparatussuch as – the design, the size of the container (several ml to several litres), the shape of the container (round bottomed or flat), nature of agitation (stirring, rotating or oscillating methods), speed of agitation performance precision of the apparatus, etc.
2. Factors relating to the dissolution fluid such as – composition (water, 0.1 N HCl, Phosphate buffer, simulated gastric fluid, simulated intestinal fluid, etc.), viscosity, volume (generally larger temperature (general 37o C) and maintenance of sink (drug concentration in solution maintained constant at a low level) or non-sink conditions (gradual increase in the drug concentration in the dissolution medium).
3. Process parameters such as method of introduction of dosage form, sampling techniques, changing the dissolution fluid, etc.
Factors Affecting the Rate of Dissolution
The dissolution rate data can be meaningful only if the results of successive test on the same dosage form are consistent with in reason. The dissolution test should yield reproducible result even when it is performed in different laboratories or with different personnel. To achieve high reproducibility, all variables that influence the test should be clearly understood and possibly controlled.
Factors affecting the dissolution rate of drugs from a dosage form include the following:
1. Factors related to the physicochemical properties of the drug.
2. Factors related to drug product formulation.
3. Effect of processing factors on the dissolution rate.
4. Factors related to dissolution test parameters.
5. Miscellaneous factors.
1. Factors related to the physicochemical properties of the drug.
Effect of solubility on dissolution: The physicochemical properties of the drug substance play a prime role in controlling its dissolution from the dosage form. The modified Noyes and Whitney equation shows that the aqueous solubility of the drug is the major factor that determines its dissolution rate.
Effect of particle size on dissolution: According to Nernst-Brunner theory, the dissolution rate is directly proportional to the surface area of the drug. Since the surface area increases with the decreasing particle size ,higher dissolution rates may be achieved through the reduction of the particle size .This effect has been highlighted by the superior dissolution rate observed after" micronization" of certain sparingly soluble drugs as opposed to the regularly milled form.
Effect of solid phase characteristics of the drug on dissolution: Amorphicity and crystallinity, the two important solid-phase characteristics of drugs affect the dissolution profile. Numerous studies have demonstrated that the amorphous form of a drug usually exhibits greater solubility and higher dissolution rate as compared to that exhibited by the crystalline form.
Effect of polymorphism on dissolution: Polymorphic forms of drugs have been shown to influence changes in solubilizing characteristics and thus the dissolution rate of' the drug in question.
2. Factors related to drug product formulation
It has been shown that the dissolution rate of a pure drug can be altered significantly when mixed with various excipients during the manufacturing process of solid dosage form .These excipients are added to satisfy certain pharmaceutical functions such as diluents (fillers), dyes, binders, granulating agents, disintegrants, and lubricants.
3. Effect of processing factors on the dissolution rate.
a) Effect of granulating agents and binders
b) Effect of disintegrants and diluents
c) Effect of lubricants
4. Factors related to dissolution test parameters.
Method of granulation: Wet granulation has been shown to improve the dissolution rates of poorly soluble drugs by imparting hydrophilic properties to the surface of the granules.
F. BIOPHARMACEUTIC CLASSIFICATION SYSTEM1
BCS is a fundamental guideline for determining the conditions under which invitro invivo correlations are expected.In the BCS, a drug is classified in one of four classes based solely on its solubility and intestinal permeability
Class – I High solubility High permeability
Class – II Low solubility High permeability
Class – III High solubility Low permeability
Class – IV Low solubility Low permeability
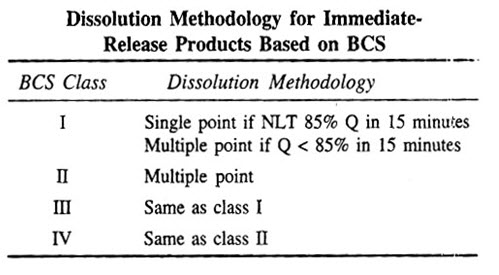
BCS for immediate release drug products & IVIVC expectations
Biopharmaceutics Drug Classification and Expected IVIVC for Immediate Release Drug Products.
BCS for extended release drug products & IVIVC expectations
Biopharmaceutics Drug Classification for Extended Release Drug Products.

S = Solubility P = Permeability
LITERATURE REVIEW
A. DISSOLUTION
Assessment of dissolution profile of marketed Aceclofenac formulations4
T Soni , N Chotai
Abstract: Statistical comparison of dissolution profiles under a variety of conditions relating to formulation characteristics, lot-to-lot, and brand-to-brand variation attracts interest of pharmaceutical scientist. The objective of this work is to apply several profile comparison approaches to the dissolution data of five-marketed aceclofenac tablet formulations. Model-independent approaches including ANOVA-based procedures, ratio test procedure, and pair wise procedure. The ratio test includes percentage, area under the curve, mean dissolution time, while the pair wise procedure includes difference factor f1, similarity factor f2, and Rescigno index. In the model-dependent approach, zero order, first order, Hixson-Crowell, Higuchi, and Weibull models were applied to the utilization of fit factors. All the approaches were applicable and useful. ANOVA with multiple comparison tests was found to be sensitive and discriminating for comparing the profiles. Weibull parameters were more sensitive to the difference between two release kinetic data in terms of curve shape and level.
Invitro dissolution studies of different brands of sustained release Diclofenac sodium matrix tablet available in Bangladesh5
MD Addnan Abdullah, Sukumar Bepary and Abu Shara Shamsur Rouf
Abstract: Commercially available national thirteen brands and three international brands of diclofenac sodium sustained release matrix tablets were studied in simulated gastric medium (pH 1.2) for 2 hours time period and simulated intestinal medium (pH 6.8) for 10 hours time period using USP reference dissolution apparatus. All the national and international brands complied with the USP in-vitro dissolution specification for drug releases in simulated gastric medium. However, four of the national brands (Code: DS-5, DS-8, DS-12, and DS-13) failed to fulfill their official requirement of 80% drug release within 8th hour in simulated intestinal medium. Drug release of those four national brands were 78.1%, 74.9%, 72.1%, and 77.8% respectively within the specified time period, however one national brand (Code: DS-2) released 83.2% drug within 6th hour in intestinal medium. Drug release profiles were analyzed for Higuchi equation, zero order, and first order to reveal the release kinetics perspective of diclofenac sodium sustained release matrix tablets. It was found that zero order release kinetics was predominant release mechanism than first order and Higuchi release kinetics for those brands (Code: DS-1, DS-3, DS-4, DS-6, DS-7, DS-9, DS-10, DS-11, DS-X, DS-Y and DS-Z) which complied with the USP in vitro dissolution specification for drug releases. On the other hand, first order release kinetics was predominant for five national substandard formulation brands (Code: DS-2, DS -5, DS-8, DS-12 and DS-13).
Dissolution Study of Active Pharmaceutical Ingredients Using the Flow Through Apparatus Usp 46
E. Beyssac and J. Lavigne
Abstract: The flow through system has been employed for many years in the testing of different dosage forms such as tablets and capsules.The flow through cell is the method of choice for extended release and poorly soluble products. Thanks to the specific powder cell it is possible to characterize a drug substance with respect to its rate of dissolution. The aim of this work was to compare the biopharmaceutical properties of different batches of a drug substance using the dissolution rate determined using the flow through apparatus. The apparatus consists of a reservoir of dissolution medium, a pump that forces the dissolution medium upwards through the flow through cell and a cell specifically designed for powders mounted vertically with a filter system preventing escape of undissolved particles. In the flow through method the test sample is located in a small-volume cell through which solvent passes at a temperature of 37 °C. Five batches of theophylline with a mean diameter of 128 μm to 673 μm and two batches of acetylsalicylic acid, either fine particles or needles, were studied. The experiment was conducted using six cells in an open system. Through the results obtained, the relationship between particle size distribution and dissolution rate has been verified. The rate of dissolution is faster for drug with low particle size and a higher surface area. The experimental parameters such as flow rate have been studied and optimized. The overall results demonstrate that it is possible to characterize the biopharmaceutical qualities of active pharmaceutical ingredients using the flow through cell. The method is reliable, reproducible and discriminating. It can easily be used to compare drugs with different particle size distributions.
In vitro System to assess the size-dependent dissolution profile of inhalable aerosols7
R Cartier, M Egen & M Kruger
Abstract: The assessment of the drug release profile from a dry powder formulation is a critical issue to evaluate bioavaibility, lung clearance and toxicology of inhalative drugs. In the present work we developed a system that mimics the inhalation and deposition process of particles in the lung and subsequently, allows the online measurement of the released drug substance. A HandiHaler® device was attached to an Anderson Cascade Impactor containing a cellulose membrane. This allowed the immobilization of a powder fraction below a defined aerodynamic diameter. The dissolution profile was determined in a Franz diffusion cell used as an air-liquid interface model. Spray dried Budesonide and Salbutamol/polymer-particles were used as test formulations. The results showed a clear differentation of particles according to their aerodynamic diameter. A faster drug release was observed with smaller particles.
Probabilistic Methods for Drug Dissolution. Part 2. Modelling a Soluble Binary Drug Delivery System Dissolving in vitro8
Ana Barat Heather J. Ruskin Martin Crane
Abstract: The objective of this work is to use Direct Monte Carlo techniques in simulating drug delivery from compacts of complex composition, taking into consideration the special features of the dissolution in vitro environment. The paper focuses on simulating a binary system, consisting of poorly-soluble drug, dispersed in a matrix of highly-soluble acid excipient. At dissolution, the acid excipient develops certain mechanisms, based on local pH modifications of the medium, which strongly influence drug release. Our model directly accounts for such effects as local interactions of the dissolving components, development of wall-roughness at the solid-liquid interface, moving concentration boundary layer and mass transport by advection. Results agree with experimental data and have demonstrated that when modelling dissolution in vitro, special attention must be paid to including the particular conditions of the dissolution environment.
A century of dissolution research: From Noyes and Whitney to the Biopharmaceutics Classification System9
Aristides Dokoumetzidis , Panos Macheras
Abstract: Dissolution research started to develop about 100 years ago as a field of physical chemistry and since then important progress has been made. However, explicit interest in drug related dissolution has grown only since the realisation that dissolution is an important factor of drug bioavailability in the 1950s. This review attempts to account the most important developments in the field, from a historical point of view. It is structured in a chronological order, from the theoretical foundations of dissolution, developed in the first half of the 20th century, and the development of a relationship between dissolution and bioavailability in the 1950s, going to the more recent developments in the framework of the Biopharmaceutics Classification System (BCS). Research on relevant fields of pharmaceutical technology, like sustained release formulations, where drug dissolution plays an important role, is reviewed. The review concludes with the modern trends on drug dissolution research and their regulatory implications.
Dissolution Improvement of High Drug-loaded Solid Dispersion10
Siriporn Okonogi and Satit Puttipipatkhachorn
Abstract : This study focused on an investigation of a high drugloaded solid dispersion system consisting of drug, carrier, and surfactant. Solid dispersions of a water-insoluble ofloxacin (OFX) with polyethylene glycol (PEG) of different molecular weights, namely binary solid dispersion systems, were prepared at drug to carrier not less than 5:5. Polysorbate 80, a nonionic surfactant, was incorporated into the binary solid dispersion systems as the third component to obtain the ternary solid dispersion systems. The powder x-ray diffraction and differential scanning calorimetric studies indicated that crystalline OFX existed in the solid dispersions with high drug loading. However, a decreased crystallinity of the solid dispersions obtained revealed that a portion of OFX was in an amorphous state. The results indicated a remarkably improved dissolution of drug from the ternary solid dispersion systems when compared with the binary solid dispersion systems. This was because of polysorbate 80, which improved wettability and solubilized the non–molecularly dispersed or crystalline fraction of OFX.
Developing Discriminatory Drug Dissolution Tests and Profiles: Some Thoughts for Consideration on the Concept and Its Interpretation11
Saeed A. Qureshi, Ph.D
Abstract: Drug dissolution profiles are increasingly used to evaluate drug release characteristics of pharmaceutical products.Discriminatory dissolution profiles are highly desirable for differentiating between products having differences in pharmaceutical attributes (formulation and/or manufacturing processes differences) that may reflect corresponding differences in vivo. Commonly in the literature,differences in the profiles based only on pharmaceutical attributes have also been described as discriminatory.This appears to have created confusion in properly defining and developing discriminating profiles.This article should help to clarify definition/concept,independent of the apparatus or procedure used ,so that proper discriminating profiles may be developed for improved evaluation of pharmaceutical products.
Comparative Dissolution Studies of Marketed Preparations and Treatment of Data by Using ANOVA12
Vijaykumar Nagabandi, M. Santhosh Kumar , G. Prasad, K. Someshwar, A.Varaprasad
Abstract: Various brands of same dosage forms are available in the market with the common claim that they are all bioequivalent. The main objective of present study was to conduct the comparative dissolution studies of various brands of same dosage form and treatment of dissolution data obtained by using Analysis of Variance (ANOVA) to determine whether all the formulations used were equivalent or significantly different. Six different brands of paracetamol 500 mg conventional tablets from different manufacturers were selected in the study and dissolution testing in 7.8 pH phosphate buffer was conducted for 6 tablets from each brand for 30 min by using electrolab automated dissolution testing apparatus USP type-II, samples were withdrawn at every 5 min time interval and analyzed for drug content by using UV/VIS double beam spectrophotometer. Percent drug release at each time interval was calculated for total 36 tablets (6X6) and the data obtained was treated with statistical technique –ANOVA. It was concluded from the study that all the formulations were equivalent and there was no intra and inter variation between each and every formulation.
NOW YOU CAN ALSO PUBLISH YOUR ARTICLE ONLINE.
SUBMIT YOUR ARTICLE/PROJECT AT articles@pharmatutor.org
Subscribe to Pharmatutor Alerts by Email
FIND OUT MORE ARTICLES AT OUR DATABASE
Studies on mechanism of enhanced dissolution of Albendazole solid dispersions with crystalline carriers13
R. Kalaiselvan , GP Mohanta , PK Manna , R Manavalan
Abstract : The main purpose of this research was to study the mechanism of drug release from solid dispersions of albendazole, giving special emphasis to particle size of the drug in solid dispersions. Solid dispersions were prepared using three different carriers, mixing ratios and methods in an attempt to improve the solubility and dissolution rate of albendazole. The mechanism of enhanced dissolution was investigated by a novel dissolution technique as an adjunct to phase solubility study, wettability test, differential scanning calorimetry, X-ray diffractometry, infrared spectroscopy and scanning electron microscopy. The solubility of albendazole was greater with albendazole-poloxamer 407 system, while polyethylene glycol dispersions showed predominant wettability. Physical mixtures showed enhanced dissolution compared with the pure drug, due to improved wetting and solubilization of drug in the diffusion layer offering carrier-rich microenvironment. Preparation of solid dispersion further improved the dissolution compared to the physical mixture, owing to increased surface area for mass transfer, thermodynamically enhanced dissolution of a higher energy amorphous form from the carrier, in addition to improved wetting and solubilization. All carriers showed comparable degree of drug particle size reduction, whereas mixing ratio and method of preparation substantially affected the particle size. Intermolecular association of drug with the carrier led to inhibition of drug recrystallization.
B. SIMILARITY FACTOR (f2)
Dissolution Profile Comparison Using Similarity Factor, f2 14
Vinod P. Shah, Yi Tsong, Pradeep Sathe and Roger L. Williams
What is a dissolution profile comparison and what is its impact?
In recent years, FDA has placed more emphasis on a dissolution profile comparison in the area of post-approval changes and biowaivers. Under appropriate test conditions, a dissolution profile can characterize the product more precisely than a single point dissolution test. A dissolution profile comparison between pre-change and post-change products for SUPAC related changes, or with different strengths, helps assure similarity in product performance and signals bioinequivalence. Among several methods investigated for dissolution profile comparison, f2 is the simplest. More and Flanner proposed a model independent mathematical approach to compare the dissolution profile using two factors, f1 and f2.
where Rt and Tt are the cumulative percentage dissolved at each of the selected n time points of the reference and test product respectively. The factor f1 is proportional to the average difference between the two profiles, where as factor f2 is inversely proportional to the average squared difference between the two profiles, with emphasis on the larger difference among all the time-points. The factor f2 measures the closeness between the two profiles. Because of the nature of measurement, f1 was described as difference factor, and f2 as similarity factor (2). In dissolution profile comparisons, especially to assure similarity in product performance, regulatory interest is in knowing how similar the two curves are, and to have a measure which is more sensitive to large differences at any particular time point. For this reason, the f2 comparison has been the focus in Agency guidance.
When the two profiles are identical, f2=100. An average difference of 10% at all measured time points results in a f2 value of 50. FDA has set a public standard of f2 value between 50-100 to indicate similarity between two dissolution profiles.
For a dissolution profile comparison:
- At least 12 units should be used for each profile determination. Mean dissolution values can be used to estimate the similarity factor, f2. To use mean data, the % coefficient of variation at the earlier point should not be more than 20% and at other time points should not be more than 10%.
- For circumstances where wide variability is observed, or a statistical evaluation of f2 metric is desired, a bootstrap approach to calculate a confidence interval can be performed.
- The dissolution measurements of the two products (test and reference, pre- and post- change, two strengths) should be made under the same test conditions. The dissolution time points for both the profiles should be the same, e.g., for immediate release products 15, 30, 45 and 60 minutes, for extended release products 1, 2, 3, 5 and 8 hours
- Because f2 values are sensitive to the number of dissolution time points, only one measurement should be considered after 85% dissolution of the product.
For products which are rapidly dissolving, i.e., more than 85% in 15 minutes or less, a profile comparison is not necessary. - A f2 value of 50 or greater (50-100) ensures sameness or equivalence of the two
curves and, thus, the performance of the two products.
A multivariate test for similarity of two dissolution profiles 15
H. Saranadasa ,K. Krishnamoorthy
Abstract: A multivariate test of sizefor assessing the similarity of two dissolution profiles is proposed. The inferential procedure is developed by using the approach for the common mean problem in a multivariate setup due to Halperin (1961). The performance of the proposed method is compared with Intersection Union Test as well as f2criterion recommended by the FDA through a simulation study. All the methods are illustrated with real examples.
Assessment of Similarity Factor Using Different Weighting Approaches16
Mukesh C.Gohel1,Krishnakant G. Sarvaiya, Neelima R.Mehta, Chirag D. Soni, Vinita U.Vyas and Rikita K. Dave
Abstract: The objective of the present work was to determine the value of similarity factor (f2) using different values of the optional weight (w) to consider the variability in dissolution data. Three approaches are proposed for establishing similarity of dissolution profiles using the Moore and Flanner equation. In the first approach, the optional weight (w) was calculated by taking the ratio of 50 to f2Th,where 50 was selected as it is the borderline value for similarity or dissimilarity of the batches and f2That is the conversion factor which takes into account variability between samples at each time point. In the second approach, the optional weight (w) was calculated by taking the ratio of the absolute difference of the percentage of drug dissolved between reference (R) and test (T) formulations to 10% of percentage of drug dissolved from the reference formulation at each time point to consider the variability between samples with more specificity. In the third approach, the weight was calculated from the equation (1+SD/ maximum allowed SD) where standard deviation (SD) was calculated from 144 data points of absolute difference between R and T of 12 reference and 12 test formulations. The maximum allowed SD was arbitrarily chosen as 10 to consider within-sample variability as well as variability between samples. The calculation steps for estimating f2 are explained using the literature reported values of dissolution study. The results of the proposed approaches are compared with the classical approach of calculating f2 (w=1). In some cases, the status of similarity changed to dissimilarity when the proposed approaches were adopted. The use of all three approaches is recommended in borderline cases of similarity. On the basis of consideration of variability, the three approaches are given preference in the order of Approach 3> Approach 2> Approach 1. Approach 3 may arouse new interest in f2 among industrial pharmacists and regulatory personnel as the within-samples variability and between-samples variability in dissolution data are considered in calculation of f2.
Statistical evaluations of dissolution similarity17
Mi-chia Ma, Ru-pyng Linand Jen-pei Liu
Abstract; Statistical properties of several criteria for assessment of similarity between two dissolution profiles are investigated. These include the similarity factor f2, and metrics based on the mean squared distance and the mean absolute difference. The probability density function of f2 and its first two moments are derived under the assumption of multivariate normality, with special attention to compound symmetry covariance structure. The intractable nature of the distribution of f2 is demonstrated. Empirical results from a large simulation study are also presented. Advantages and drawbacks of procedures based on the mean absolute difference and mean squared distance are discussed.
Refinement of Lower Acceptance Value of the Similarity Factor f2in Comparison of Dissolution Profiles18
Mukesh C. Gohe and Maulik K. Panchal
Abstract: Dissolution testing has become an essential tool in the pharmaceutical industry at various stages of development, manufacturing and marketing. For the comparison of dissolution profiles, similarity factor f2 is gaining popularity due to its recommendation by various regulatory committees. Dissolution profiles are considered similar if the calculated f2 value is between 50 and 100.In our opinion, this acceptance limit might not be correctly defined. This article presents the reasons for the same and a new equation to define the lower acceptance limit for different data sets. It is proposed that regulatory agencies should actively consider the revision of the lower acceptance value for f2.
Investigating the impact of process parameters on similarity factor (f2) via a modeling approach19
K. Riviere, J. Duan
Purpose:To investigate how the parameters of the Weibull model, which is used to fit dissolution data, are related to the f2 similarity factor and how formulation or process parameters influence dissolution profiles as well as the f2 similarity factor.
Methods: Using the program R, we simulated various dissolution profiles by using the Weibull model and by varying the model parameters MDT (mean dissolution time), B (shape parameter), and Dmax (maximum dissolved). Then, the generated profiles were compared to a reference profile, and f2 was calculated. Also, we used available data where the effects of formulation and process variants on the dissolution profile of an oral tablet formulation were evaluated. We used the Weibull model to fit the test and reference dissolution profiles and then determined the MDT, Dmax, and B of these profiles. Furthermore, plots of f2 vs. model parameters (MDT, B, and Dmax) are being generated to predict what ranges in these parameters allow f2>50. We will use the actual data to determine if our predictions are accurate.
Results: Using the simulated data, f2 values for each pair of test-reference dissolution profiles were calculated. A portion of the results are shown in the left Figure where the solid line is the reference profile and the dashed and dotted lines are the simulated profiles with the parameters labeled on the top of each panel. The calculated f2values are also labeled.
Additionally, plots of manufacturing parameters vs. model parameters (MDT, B, and Dmax) were generated. A plot showing the relationship between shape parameter B and a manufacturing parameter is presented. The results indicated that the manufacturing parameter 3 affected the dissolution of the drug product, and this effect was mainly on the shape of the dissolution profile.
Bootstrap f2 (Similarity Factor) for Dissolution Profile Comparisons20
J. Z. Duan, M. Shen, A. Chen, K. Riviere, Y. Tsong
Purpose: To explore the alternatives for dissolution profile comparison when large variability makes simple f2 comparison not feasible.
Methods: We analyzed an available dissolution dataset of 12 units of reference samples and 12 units of test formulations with high variability (~50% CV early timepoints; ~ 20% CV later timepoints) using a bootstrap approach. Twelve dosage units were randomly selected with replacements from the reference and test products. The means of these selected units at each timepoint were used to calculate f2 values. This process was repeated 10,000 times. The f2 values of the original data, the bootstrapped data, and the distributions of the bootstrapped f2 values were obtained. 90% confidence intervals were calculated using the percentile method and the bias-corrected and accelerated (BCA) approach. The percentile interval did not assume normality, but it did assume that the bootstrap distribution was symmetric and unbiased for the population value. When the results were not symmetric and/or were biased, the BCA confidence interval (CI) was used. Both SAS and R bootstrapping methods were developed to analyze the dataset. The SAS macro used PROC SURVEYSELECT and PROC UNIVARIATE. The R program used packages of base, stats, graphics, reshape, and boot.
Results: We generated a series of histograms and Q-Q plots in which the f2 calculated using original data (f2 orig, indicated by a dotted vertical line), the bootstrap mean (Boot mean), and the lower 90% CI using the percentile and BCA methods are displayed. Two typical cases are presented in the The BCA approach is more appropriate due to the skewness of the distribution although the percentile and BCA CI’s are similar under these cases.
In Vivo Bioequivalence and In Vitro Similarity Factor (f2) for Dissolution Profile Comparisons of Extended Release Formulations21
Duan JZ, Riviere K, Marroum P
How and When Do They Match?
Purpose
To investigate how likely two extended release formulations are to be bioequivalent when they demonstrate f2 similarity.
Method
Dissolution profiles were simulated using the Weibull model and varying model parameters around those of a reference profile. The f2 values were calculated for the comparisons of each simulation with the reference profile. The in vivo inputs obtained from an in vitro-in vivo correlation model were convolved with a unit impulse response function. The AUC, Cmax, and Tmax from each simulated in vivoconcentration profile were compared to the reference profile. The AUCR (AUC ratio) and CmaxR (Cmax ratio) were determined. The consistency between f2 and bioequivalence was investigated.
Results
The relationships between AUCR, CmaxR, f2 and the Weibull model parameters demonstrate that the bioequivalence regions enclosed by the contour lines of 80% and 125% of AUCR and CmaxR were generally close to the regions enclosed by the f2=50 contour line, but did not exactly match, especially when Dmax and B deviated from the reference values.
Conclusions
When f2 is used for in vitro dissolution profile comparison, the completeness of the dissolution profiles should not differ more than 10%, and the shapes of the dissolution profiles should not be significantly different.
An alternative method to the evaluation of similarity factor in dissolution testing22
P. Costa
Abstract
This paper addresses an alternative method to the evaluation of similarity factor f2 as a criterion for assessment of similarity between two in-vitro dissolution profiles as proposed in the SUPAC-IR Guidance (1995). Diltiazem hydrochloride Sustained-Release (SR) tablets were tested and the following independent-model dissolution parameters were used: t10% dissolution time, t25% dissolution time, t50%dissolution time, mean dissolution time (MDT), dissolution efficiency (DE) at t120, and at t360. To compare the dissolution profiles, several release models were tested such as Higuchi, zero order, first order, Baker-Lonsdale, Hixson-Crowell, Weibull and Korsmeyer-Peppas. The similarities between two in-vitro dissolution profiles were assessed by pair-wise independent-model procedures such as difference factor (f1), similarity factor (f2) and Rescigno index (ξ1 and ξ2). The in vitro release kinetics of diltiazem hydrochloride sustained release tablets were evaluated using USP apparatus 2.
In Vitro Dissolution Profile Comparison—Statistics and Analysis of the Similarity Factor, f2 23
Vinod Shah , Yi Tsong , Pradeep Sathe , Jen-Pei Liu
Purpose. To describe the properties of the similarity factor (f2) as a measure for assessing the similarity of two dissolution profiles. Discuss the statistical properties of the estimate based on sample means.
Methods. The f2 metrics and the decision rule is evaluated using examples of dissolution profiles. The confidence interval is calculated using bootstrapping method. The bias of the estimate using sample mean dissolution is evaluated.
Results. 1. f2 values were found to be sensitive to number of sample points, after the dissolution plateau has been reached. 2. The statistical evaluation of f2 could be made using 90% confidence interval approach. 3. The statistical distribution of f2 metrics could be simulated using 'Bootstrap' method. A relatively robust distribution could be obtained after more than 500 'Bootstraps'. 4. A statistical 'bias correction' was found to reduce the bias.
Conclusions. The similarity factor f2 is a simple measure for the comparison of two dissolution profiles. But the commonly used similarity factor estimate f2 is a biased and conservative estimate of f2 . The bootstrap approach is a useful tool to simulate the confidence interval.
Application of similarity factor in development of controlled release diltiazem tablet24
PehKK,WongCF
Abstact
Controlled-release grade hydroxy propyl methyl cellulose (HPMC) or xanthan gum (XG) and microcrystalline cellulose (MCC) were employed to prepare controlled-release diltiazem hydrochloride tablets. The similarity factor f2 was used for dissolution profile comparison using Herbesser 90 SR as a reference product. Drug release could be sustained in a predictable manner by modifying the content of HPMC or XG. Moreover, the drug release profiles of tablets prepared using these matrix materials were not affected by pH and agitation rate.
The f2 values showed that only one batch of tablets (of diltiazem HCl, HPMC or XG, and MCC in proportions of3.0:3.0:4.0) was considered similar to that of the reference product, with values above 50. The unbiased similarity factor f2 values were not much different from the f2 values, ascribing to a small dissolution variance of the test and reference products. The amount of HPMC or XG incorporated to produce tablets with the desired dissolution profile could be determined from the curves of f2 versus polymer content. Hence, the f2 values can be applied as screening and optimization tools during development of controlled-release preparations.
Using the similarity factor f2 in practice: A critical revision and suggestions for its standard error estimation25
Jordi Ocana , Gloria Frutos and Pilar Sanchez O
Abstract
The purpose of this research was to develop new procedures with the aim of improving the usage of the similarity factor f2 in dissolution data analysis, and to evaluate them jointly with preexisting ones. We introduce bias-correction and standard error estimation procedures based on the delta, the jackknife and the bootstrap methods. These methods, jointly with the rule of declaring similarity when f2 exceeds 50 and some alternative testing procedures based on bootstrap confidence intervals, are evaluated on experimental data and studied by simulation. The results indicate that no method is strictly the best, but the following conclusions seem to appear: for estimation purposes the most reliable approach is to use the plain sample f2 instead of any bias-corrected alternative, any of the standard error estimates may be used in practice and, most importantly, there are evidences against the validity of the procedure declaring similarity if the sample f2 exceeds 50; a decision rule based on a confidence interval seems to be more adequate. In any case the question should be further investigated.
ACECLOFENAC
Development of Discriminating Method for Dissolution of Aceclofenac Marketed Formulations26
Tejal Soni , Chirag Nagda ,Teja Gandhi and N. P. Chotai
Abstract
The development of a meaningful dissolution procedure for drug products with limited water solubility has been a challenge to the pharmaceutical industry. Aceclofenac (BCS Class II drug) is a nonsteroidal anti-inflammatory drug. There is no official dissolution medium available in the literature. In the present study, parameters such as solubility, medium pH, surfactant type, dissolution behavior of formulations, influence of sink conditions, stability, and discriminatory effect of dissolution testing were studied for the selection of a proper dissolution medium. Results of solubility data revealed that solubility increased with an increase in pH. Sink conditions were exhibited in all media except double-distilled water and 0.1 N HCl. The drug and marketed formulations were stable in the dissolution media used. An agitation speed of 50 rpm showed a more discriminating drug release profile than 75 rpm. The discriminating dissolution method for aceclofenac formulation is paddle at 50 rpm, 900 mL pH 6.8 phosphate buffer, greater than 80% of the label amount is released over 60 minutes.
Assessment of Dissolution Profile of Aceclofenac Tablets Available in Bangladesh27
Tajnin Ahmed, Afia Ferdous, Subrata Kumar Biswas, Farhana Sharif
Abstract
The objective of this work is to find out brand-to-brand variation by applying profile comparison approaches to the dissolution data of marketed aceclofenac tablet formulations. Commercially available five brands of aceclofenac tablets were studied in simulated intestinal medium (pH 6.8) for 60 minutes time period using USP reference dissolution apparatus. Four samples complied with the USP in vitro dissolution specifications for drug release (not less than 80% of the labeled amount of Aceclofenac should be dissolved in 60 minutes). One brand (Code: S1) failed to meet the criteria; drug release was 66.85% within the specified time period.
Assessment of dissolution profile of marketed aceclofenac formulations4
Soni T, Chotai N.
Abstract
Statistical comparison of dissolution profiles under a variety of conditions relating to formulation characteristics, lot-to-lot, and brand-to-brand variation attracts interest of pharmaceutical scientist. The objective of this work is to apply several profile comparison approaches to the dissolution data of five-marketed aceclofenac tablet formulations. Model-independent approaches including ANOVA-based procedures, ratio test procedure, and pair wise procedure. The ratio test includes percentage, area under the curve, mean dissolution time, while the pair wise procedure includes difference factor (f1), similarity factor (f2), and Rescigno index. In the model-dependent approach, zero order, first order, Hixson-Crowell, Higuchi, and Weibull models were applied to the utilization of fit factors. All the approaches were applicable and useful. ANOVA with multiple comparison tests was found to be sensitive and discriminating for comparing the profiles. Weibull parameters were more sensitive to the difference between two release kinetic data in terms of curve shape and level.
Development and Characterization of Once a Daily Tablet Formulation of Aceclofenac28
Punit B. Parejiya, Bhavesh S. Barot, Hetal K. Patel, Pragna K. Shelat
Abstract
Sustained release Aceclofenac matrix tablets constituting Kollidon SR (Polyvinyl acetate- povidone based matrix retarding polymer) were developed for manifesting desirable release profile. Matrix tablets were prepared by direct compression of Kollidon SR varying proportion with fixed percentage of aceclofenac. Tablets containing 50 % Kollidon SR demonstrated a rapid rate of drug release with an initial burst effect. Incorporation of more Kollidon SR in the tablet prolonged drug release with subsequent minimization of burst effect as confirmed by mean dissolution time, dissolution efficiency, f2 and drug release kinetic data. The formulation showed close resemblance to commercial product Senafen. The results were explored and explained by the difference of physico-chemical property and micromeritic characteristics. Insignificant effect of various factors e.g. pH, ionic strength, paddle speed was found on drug release. The formulation followed Korsmeyer and peppas kinetic of drug release. Stability study data indicated stable character after short term stability study.
Formulation and Evaluation of Sustained Release Tablets of Aceclofenac using Hydrophilic Matrix System29
Subramaniam Kannan, Rangasamy Manivannan, Kugalur Ganesan Parthiban Kakkatummal Nishad and Natesan Senthil Kumar
Abstract
The objective of the present study was to develop “once daily” sustained release tablets of Aceclofenac (200mg) by wet granulation using hydrophilic polymer like Hydroxy propyl methyl cellulose K -100. The drug excipient mixtures were subjected to preformulation studies. The tablets were subjected to physicochemical studies, in- vitro drug release, kinetic studies and stability studies. FTIR studies shown there was no interaction between drug and polymer. The physicochemical properties of tablets were found within the limits. Aceclofenac is a non steroidal anti-inflammatory agent used in symptomatic treatment of rheumatoid arthritis, osteoarthritis and spondylitis. The drug release from optimized formulations was extended for a period of 24 hrs. The kinetic treatment of selected formulation (F8) showed that the release of drug follows zero order models. The optimized formulations were subjected to stability studies for one month at 45° temperature with RH 75±5% and showed there were no significant changes in drug content, physicochemical parameters and release pattern. Results of the present study indicated the suitability of hydrophilic polymers in the preparation of matrix based sustained release formulation of Aceclofenac.
Formulation and evaluation of fast dissolving tablet of Aceclofenac30
Sudhir Bhardwaj, Vinay Jain, R.C. Jat, Ashish Mangal, Suman Jain
Abstract
Fast disintegrating drug delivery system offers a solution for these patients having difficulty in swallowing tablets/ capsules etc. Aceclofenac (anti-inflammatory and analgesic) was selected as the model drug. The poor aqueous solubility of the drug results in variable dissolution rate and hence poor bioavailability. In the present study, an attempt had been made to prepare fast dissolving tablets of the drug using various super disintegrates sodium starch glycolate following by direct compression technique. The tablets were evaluated for hardness, friability, weight variation, disintegration time, water absorption ratio and wetting time, in vitro dissolution studies. All the formulation showed disintegration time in range of 12.2 to 27.5 second along with rapid in vitro dissolution. It was concluded that the fast dissolving tablets of the poor soluble drug can be made by direct compression technique using selective super disintegrantes showing enhanced dissolution, taste masking and hence better patient compliance and effective therapy.
Preparation and evaluation of aceclofenac sustained release formulation and comparison of formulated and marketed product31
Santanu Ghosh and B. B. Barik
Abstract:
The objective of the study was to develop matrix tablets for oral controlled release of aceclofenac. Matrix tablets of aceclofenac, using various viscosity of hydrophilic polymer HPMC in two different proportions, hydrophobic polymer ethyl cellulose and Guar gum were prepared by wet granulation method and subjected to in vitro drug release studies. The drug release from all HPMC matrix tablets followed various release kinetics, formulation no -F7 followed higuchi kinetics. Furthermore, the results of the in vitro studies in pH 7.5 phosphate buffer medium showed that F7 tablets provided controlled release comparable with market sustained release formulation (Aeroff-SR tablets). F7 tablets showed no change in physical appearance, drug content, or in dissolution pattern after storage at 40°C with 75% RH for 6 months. Based on the results of the in vitro studies, it was concluded that the HPMC matrix tablets provided oral controlled release of aceclofenac.
Formulation and evaluation of once-daily sustained release Aceclofenac Prosophis juliflora gum matrix tablets32
Hindustan Abdul Ahad, Chitta Suresh Kumar, Pilli Yesupadam, Harika B, Deepika D, Leela Lakshmi V, Chandra Sekhar A
Abstract
The main aim of the present investigation was to develop matrix tablets of Aceclofenac with Prosophis juliflora gum and to study its functionality as a matrix forming agent for once daily sustained release tablet formulations. Physicochemical properties of dried powdered Prosophis juliflora gum were studied. Various formulations of Aceclofenac Prosophis juliflora gum were prepared. The formulated tablets found to have better uniformity of weight and drug content with low SD values. The swelling behavior and release rate characteristics were studied. The dissolution study proved that the dried Prosophis juliflora gum can be used as a matrix forming material for making once daily Sustained release matrix tablets.
Development of colon specific drug delivery of Aceclofenac by using effective binder system of Ethyl Acetate Cellulose33
Raosaheb S. Shendge , Fatima J. Sayyad , Kishor S.Salunnkhe and D.Bhalke
Abstract
Colon targeted drug delivery system by using dextrin, polysaccharide, as a carrier for Aceclofenac is the objective of the present study. Very common wet granulation technique is used for preparation of matrix tablet. Different binder like ethyl cellulose, sodium CMC and sucrose were used during preparation of matrix tablets containing dextrin and various excipients. Evaluation was done by different IPQC tests, content uniformity and in vitro drug release study. Drug release profile was evaluated in simulated gastric, intestinal fluid and simulated colonic fluid. Drug release profile in simulated gastric, intestinal fluid and colonic fluid decide the best formulation. The matrix tablet containing binder system of ethyl cellulose and dextrin as a carrier was found to be suitable for targeting the colon as compare to other matrix tablets containing different binders because of fewer amounts (8-10%) of drug release in the simulated gastric and intestinal fluid. Matrix tablets containing dextrin releases 82.43 % of Aceclofenac in simulated colonic fluid with 4 % human fecal matter solution. No change was found in physical appearance and dissolution profile upon storage at 400C / 75 % relative humidity for six months with the tablets containing dextrin polysaccharide as a carrier. Ethyl cellulose as binder was most suitable binder to deliver the drug specifically in colonic region as compare to matrix tablets of dextrin with other binder systems.
Simultaneous estimation of aceclofenac, tramadol hydrochloride and paracetamol by UV spectrophotometric simultaneous equation method from tablet formulation34
Deepali Gharge, Pandurang Dhabale.
Abstract
A simple, accurate, precise and economical procedure for simultaneous estimation of aceclofenac, tramadol hydrochloride and paracetamol in three component tablet dosage form has been developed utilizing concept of internal standard addition. The method is based upon determination of aceclofenac at 275.5nm, tramadol hydrochloride at 271.0 nm and paracetamol at 247.0 nm in methanol diluted with distilled water. Aceclofenac, tramadol hydrochloride and paracetamol at their respective ëmax 275.5nm, 271.0 nm and 247.0 nm shows linearity in the concentration range of 5- 25 ìg/ml, 20-100 ìg/ml and 3-15 ìg/ml respectively. The method was validated statistically. Recovery study was performed to confirm the accuracy of the method.]
Studies on Aceclofenac solid dispersion in corporated gels : Development , Characterisation and Invitro Evaluation35
Aejaz A , Azmail K , Sanaullah S , Mohsin A
Abstract
Aceclofenac, an analgesic and anti inflammatory drug is used in treatment of osteo arthritis, rheumatoid arthritis and ankylosing spondylitis. Various compositions of Aceclofenac solid dispersions were prepared by physical mixing, fusion and solvent evaporation methods using. PVP, PEG 6000, mannitol and urea as carrier to enhance the solubility of drug. The formulations evaluated for drug content, invitro dissolution study and also characterized by IR and DSC studies. There is no interaction between drug and carrier. The general trend indicated that there was a increase in invitro drug release for solid dispersion prepared in the following order Urea > PEG 6000 > PVP > Mannitol. Based on invtiro drug release pattern, 1:3 drug carrier ratio was selected as ideal dispersion for gels. HPMC selected as ideal gel base for preparation of gels and dispersions are incorporated to gel bases by trituration. Formulations were characterized for rheological studies, drug content estimation and invitro diffusion study, IR spectro scopy. All these properties were found to be ideal. The in vitro release of Aceclofenac solid dispersion incorporated gel is significantly improved when compared to pure drug in corporated gel.
RP-HPLC method for determination of Aceclofenac , Chlorzoxazone and Paracetamol in bulk and pharmaceutical formulation36
H. Yadav,L. P. Kothapalli , A. N. Barhate, H. I. Pawar, C.R.Pawar .
Abstract
A reverse phase high performance liquid chromatographic method (HPLC) has been developed for the simultaneous estimation of Aceclofenac (ACE), Chlorzoxazone (CHZ) and Paracetamol (PARA) in the pharmaceutical formulation using RP-C8 column. The mobile phase (Acetonitrile and Double distilled water) was pumped at a flow rate of 1 ml/min in the ratio of 60:40 and the eluents were monitored at 230.0 nm. Linearity was obtained in the concentration range of 1-60 μg/ml for ACE, 1-50 μg/ml for both PARA and CHZ. The method was statistically validated and RSD was found to be less than 2% indicating high degree of accuracy and precision of the proposed HPLC method. Due to its simplicity, rapidness, high precision and accuracy, the proposed HPLC method may be used for determining Aceclofenac, Chlorzoxazone and Paracetamol in bulk drug samples or in pharmaceutical dosage form.
PROFILES
Drug Profile
ACECLOFENAC37
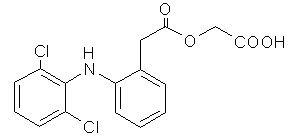
Aceclofenac is an orally administered phenyl acetic acid derivatives with effects on a variety of inflammatory mediators.
CAS Registry Number: 89796-99-6
Molecular Weight: 354.2
Molecular Formula : C16H13Cl2NO4
Melting Point : 149-153 ° C
Chemical Name : 2-[[2-[2-[(2, 6-dichlorophenyl) amino] phenyl] acetyl] oxy] acetic acid.
Content: Aceclofenac contains not less than 99.0% and not more than the equivalent of 101.0 percent of C16H13Cl2NO4 calculated on the dried basis.
Description: It is a white or almost white crystalline powder.
Solubility: Practically insoluble in water, Freely soluble in acetone, Soluble in alcohol(95%) .
Storage: Stored in air tight container protected from light at room temperature not exceeding 300c.
Therapeutic-Category: Anti-inflammatory; analgesic.
pKa : 4.7
Specifications:
|
Loss on drying |
≤0.5% |
|
Heavy metals |
≤10ppm |
|
Sulphated ash |
≤0.1% |
|
Related substances(HPLC) |
Single impurity ≤0.2% |
|
Assay |
99.0%-101.0% |
It is an effective analgesic and anti-inflammatory agent with a good tolerability profile. Through its analgesic and anti-inflammatory properties, aceclofenac provides symptomatic relief in a variety of painful conditions. A reduction in the stimulated generation of reactive oxygen species (O2), which may play a role in joint damage, was observed after 15 days in these patients, but after 180 days. At day 180, O2 release was similar to that seen in a group of 41 healthy untreated individuals.
Pharmacology
The mode of action of aceclofenac is largely based on the inhibition of prostaglandin synthesis. Aceclofenac is a potent inhibitor of the enzyme cyclooxygenase, which is involved in the production of prostaglandins.
The Drugs inhibits synthesis of the inflammatory cytokines interleukin (IL)-1 and tumor necrosis factor and prostaglandin E2 (PGE2) production. Effects on cell adhesion molecular from neurophils have also been noted. In vitro data indicate inhibition of cyclooxygenase (Cox)-1 and 2 by aceclofenac in whole blood assays, with selectivity for Cox-2 being evident.
Aceclofenac has shown stimulatory effects on cartilage matrix synthesis that may be linked to the ability of the drug to inhibit IL-1 activity. In vitro data indicate stimulation by the drug of synthesis of glycosaminoglycan in osteoarthritic cartilage.
There is also evidence that aceclofenac stimulates the synthesis of IL-1 receptor antagonist in human articular chondrocytes subjected to inflammatory stimuli and that 4'-hydroxyacelofenac has chondroprotective properties attributable to suppression of IL-1 mediated promatrix metalloproteinase production and proteoglycan release.
In patients with osteoarthritis of the knee, aceclofenac decrease pain reduces disease severity and improves the functional capacity of the knee. It reduces joint inflammation, pain intensity and the duration of morning stiffness in patients with rheumatoid arthritis. The duration of morning stiffness and pain intensity are reduced and spinal mobility improved, by aceclofenac in patients with ankylosing spondylitis.
Pharmacokinetics
Aceclofenac is rapidly and completely absorbed after oral administration, peak plasma concentrations are reached 1 to 3 hours after an oral dose. The drug is highly protein bound (7.99%). The presence of food does alter the extent of absorption of aceclofenac but the absorption rate is reduced. The plasma concentration of aceclofenac was approximately twice that in synovial fluid after multiple doses of the drug in-patient with knee pain and synovial fluid effusion.
Aceclofenac is metabolized to a major metabolite, 4'-hydroxyaceclofenac and to a number of other metabolites including 5-hydroxyaceclofenac, 4'-hydroxydiclofenac, diclofenac and 5-hydroxydiclofenac. Renal excretion is the main route of elimination of aceclofenac with 70 to 80% of an administered dose found in the urine, mainly as the glucuronides of aceclofenac and its metabolites of each dose of aceclofenac, 20% is excreted in the faeces. The plasma elimination half-life of the drug is approximately 4 hours.
Drug Interactions
Aceclofenac may increase plasma concentrations of lithium, digoxin and methotrexate, increase the activity of anticoagulant, inhibits the activity of diuretics, enhance cyclosporin nephrotoxicity and precipitate convulsions when co-administered with quinolone antibiotics.
Furthermore, hypo or hyperglycaemia may result from the concomitant administration of aceclofenac and antidiabetic drugs, although this is rare. The co administration of aceclofenac with other NSAIDS of corticosteroids may results in increased frequency of adverse event.
Adverse Drug Reaction
Aceclofenac is well tolerated, with most adverse events being minor and reversible and affecting mainly the GI system. Most common events include dyspepsia (7.5%), abdominal pain (6.2%), nausea (1.5%), diarrhea (1.5%), flatulence (0.8%), gastritis (0.6%), constipation (0.5%), vomiting (0.5%), ulcerative stomatitis (0.1%), pancreatitis (0.1%).
Although the incidence of gastro intestinal adverse events with aceclofenac was similar to those of comparator NSAIDS in individual clinical trials, withdrawal rates due to these events were significantly lower aceclofenac than with ketoprofen and tenoxicam.
Other adverse effect, which is not common such as dizziness (1%), vertigo (0.3%), and rare cases: par aesthesia and tremor.
Dosage and Administration
The usual dose of aceclofenac is 100 mg given twice daily by mouth, one tablet in the morning and one in the evening. There is no evidence that the dosage of aceclofenac needs to be modified in patients with mild renal impairment, but as with other NSAIDS caution should be exercised.
However data from human whole blood assays show inhibition of cox-2 (with minimal effects on cox-1) by both the parent compound and 4'-hydroxyaceclofenac. IC50 values of cox-1 and cox-2 respectively were > 100 and 0.8 for aceclofenac and > 100 and 36 for 4'-hydroxyaceclofenac.
METHODOLOGY
1. Meterials used:
|
S .No |
Meterials |
Supplied by |
|
1 |
Aciday marketed tablet |
Days Health Care |
|
2 |
Aceclo marketed tablet |
Aristo pharmaceuticals Pvt.Ltd |
|
3 |
Hifenac marketed tablet |
Intas pharmaceuticals |
|
4 |
Disodium hydrogen phosphate |
Qualigens |
|
5 |
Potassium dihydrogen phosphate |
Qualigens |
|
6 |
HCl |
Nice Chemicals pvt.Ltd, Chennai |
|
7 |
NaoH |
WEBChemi |
2. Equipments Used:
|
S .No |
Equipments |
Supplied by |
|
1 |
UV/visible spectrophotometer double beam |
Elico SL-164,Hyd |
|
2 |
Dissolution test apparatus |
Electro lab TDT,O6P |
|
3 |
Single pan digital balance |
Contech |
|
4 |
Digital pH meter |
Hanna Instrument |
AIM & PLAN OF WORK
- Calibration curve
- Selection of marketed brands
- Invitro dissolution studies for aceclofenac selected marketed brands
- Results and discussion
- Conclusion
6. METHODS
A. CALIBRATION CURVE
Construction of standard curve for Aceclofenac:
Aceclofenac can be estimated spectrophotometrically at 273 nm as it obeys Beer-Lambert′ s Law.
Preparation of phosphate buffer pH 7.5:-
Solution-I
119.31 gm of disodium hydrogen phosphate dissolve in 1000 ml of distilled water.
Solution-II
45.36 gm of potassium dihydrogen phosphate dissolve in 1000 ml of distilled water.
Preparation :-
850 ml of solution I and 150 ml of solution II to produce 1000 ml.
Preparation of standard drug solution:-
Stock Solution:
50 mg of Aceclofenac was dissolved in 50 ml of phosphate buffer pH 7.5,so as to get a stock solution of 1000 µg/ ml concentration.
Standard Solution :
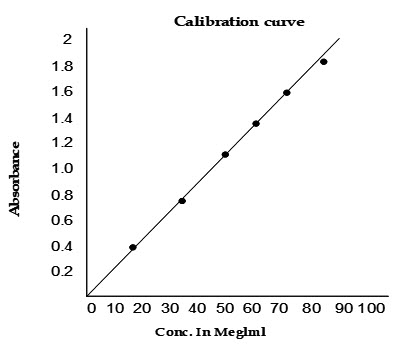
10 ml of Stock Solution was made to 100 ml with phosphate buffer pH 7.5 thus giving a concentration of 100 µg/ ml. Aliquot of standard drug solution ranging from 1 to 10 ml were transferred into 10 ml volumetric flask and were diluted upto the mark with phosphate buffer pH 7.5.Thus the final concentration ranges from 1-10 µg/ml . Absorbance of each solution was measured at 273 nm against phosphate buffer pH 7.5 as a blank.A plot of concentrations of drug versus absorbance was plotted.
The linear regression analysis was done on absorbance data points. A straight line equation was generated to facilitate the calculation of amount of drug.
The equation is as follows,
Y= mx + c
Where Y= Absorbance
m= Slope
X= Concentration
C=Intercept
calibration curve for the estimation of aceclofenac in phosphate buffer pH 7.5
|
concentration (µg/ml) |
absorbance (273nm) |
|
0 |
0 |
|
10 |
0.236 |
|
20 |
0.532 |
|
30 |
0.838 |
|
40 |
1.007 |
|
50 |
1.282 |
|
60 |
1.586 |
|
70 |
2.190 |
|
80 |
2.192 |
|
90 |
2.492 |
|
100 |
2.497 |
|
slope |
0.02706 |
|
regression |
0.99087 |
SELECTION OF MARKETED BRANDS
|
Brand Names |
Manufactured by |
Mfg.Lic.No |
Mfg Date |
Exp Date |
Composition |
|
HIFENAC |
INTAS Pharmaceuticals |
15/UA/2006 |
Jan 2010 |
Dec 2012 |
Each film coated tablet contains Aceclofenac IP 100mg |
|
ACIDAY |
DAYS Health Care |
MNB/05/265 |
Sep 2009 |
Aug 2011 |
Each Each film coated tablet contains Aceclofenac BP 100mg |
|
ACECLO |
ARISTO Pharmaceuticals pvt.Ltd |
DO/133 |
Mar 2010 |
Feb 2012 |
Each film coated tablet contains Aceclofenac IP 100mg |
In vitro dissolution studies for Aceclofenac selected marketed brands
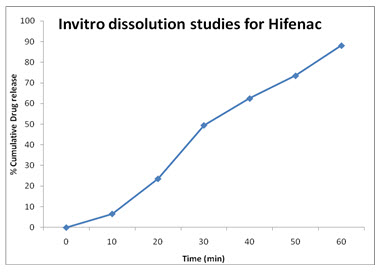
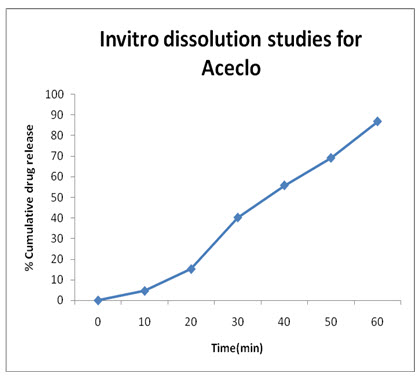
Dissolution studies were carried out for all the formulations, employing USP XXIII apparatus (paddle method) at 37± 0.5 ◦C rotated at constant speed of 50 rpm using phosphate buffer ( PH : 7.5) as the dissolution medium. A sample of solution of Aceclofenac tablets was used in each test. An aliquot of the sample was periodically with drawn at suitable time interval and the volumes were replaced with fresh dissolution medium in order to maintain the skin condition. The sample was analyzed spectrophotometrically at 273 nm.
HifenaC: (REFERENCE)
|
Time (Min) |
Absorbance (273 nm) |
Concentration |
% Cumulative Drug Release |
|
|
(mcg/ml) |
(mg/ml) |
|||
|
0 |
0.00 |
0.00 |
0.00 |
0.00 |
|
5 |
0.020 |
0.73 |
0.66 |
6.6% |
|
10 |
0.071 |
2.62 |
2.36 |
23.6% |
|
20 |
0.149 |
5.50 |
4.95 |
49.5% |
|
30 |
0.188 |
6.94 |
6.25 |
62.5% |
|
45 |
0.221 |
8.16 |
7.35 |
73.5% |
|
60 |
0.265 |
9.79 |
8.81 |
88.1% |
Aceclo: (test-1)
|
Time (Min) |
Absorbance (273 nm) |
Concentration in |
% Cumulative Drug Release |
|
|
(mcg/ml) |
(mg/ml) |
|||
|
0 |
0.00 |
0.00 |
0.00 |
0.00 |
|
5 |
0.014 |
0.51 |
0.46 |
4.6% |
|
10 |
0.046 |
1.69 |
1.52 |
15.2% |
|
20 |
0.121 |
4.47 |
4.02 |
40.2% |
|
30 |
0.168 |
6.20 |
5.58 |
55.8% |
|
45 |
0.208 |
7.68 |
6.91 |
69.1% |
|
60 |
0.261 |
9.64 |
8.68 |
86.8% |
ACIDAY: (TEST-2)
|
Time (Min) |
Absorbance (273 nm) |
Concentration |
% Cumulative Drug Release |
|
|
Mcg/ml |
mg/ml |
|||
|
0 |
0.00 |
0.00 |
0.00 |
0.00 |
|
5 |
0.018 |
0.66 |
0.59 |
5.9% |
|
10 |
0.049 |
1.81 |
1.62 |
16.2% |
|
20 |
0.135 |
4.98 |
4.49 |
44.9% |
|
30 |
0.186 |
6.87 |
61.8 |
61.8% |
|
45 |
0.224 |
8.27 |
7.45 |
74.5% |
|
60 |
0.263 |
9.71 |
8.74 |
87.4% |
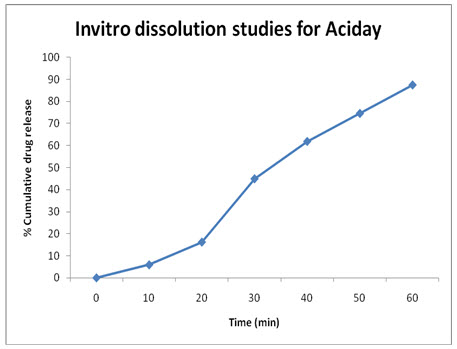
Table – 1: Invitro drug release studies for Reference, Test 1 & Test 2
|
TIME (min) |
Reference HIFENAC % cumulative drug release |
Test 1 ACECLO % cumulative drug release |
TEST 2 ACIDAY %cumulative drug release |
|
5
10
20
30
45
60
|
6.6%
23.6%
49.5%
62.5%
73.5%
88.1% |
4.6%
15.2%
40.2%
55.8%
69.1%
86.8% |
5.9%
16.2%
44.9%
61.8%
74.5%
87.4% |
RESULTS & DISCUSSION:
The aim of the present study is to determine the similarity factor and difference factors between three different marketed brands available locally. The brands are ACECLO, HIFENAC and ACIDAY. Hifenac contains 100mg of Aceclofenac and it is taken as reference. The remaining two dosage forms are taken as Test1, Test 2 they are ACECLO and ACIDAY respectively.
Comparison of Reference with test sample is to determine the similarity factor (f2) and Difference factor (f1) by in vitro drug release studies maintained at 370 ± 0.50C Temperature, 50 rpm and the finally at regular intervals of time 5, 10, 20, 30, 45 and 60 min. The drug release data has been shown in the Table 1.
Similarity factor (f2) was calculated by using formula

where n = number of dissolution time points
Rt = dissolution value of the reference drug product at time t
Tt = dissolution value of the test drug product at time t
f2 was calculated by multipoint analysis and the results were found to be
- Reference verses Test 1 = 60.26
- Reference verses Test 2 = 71.29
From the above two results reference dosage form was found to equivalent with Test 1 and Test 2.
Difference factor (f1) was calculated by using formula
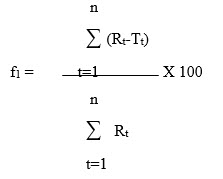
where n = number of dissolution time points
Rt = dissolution value of the reference drug product at time t
Tt = dissolution value of the test drug product at time t
f1 was calculated by multipoint analysis and the result were found to be
- Reference verses Test 1 = 10.5
- Reference verses Test 2 = 4.31
From the difference factor it was found to be there is no difference between above results.
CONCLUSION
Dissolution testing has become an essential tool in the pharmaceutical industry at various stages of development, manufacturing and marketing. Dissolution testing is a very important in vitro test for evaluating drug products. The dissolution testing of Aceclofenac was done by the use of 900 ml of pH 7.5 phosphate buffer at 37 ± 0.5 °C, a paddle speed of 50 ± 5 rpm for film-coated formulations Hifenac, Aceclo, Aciday, and a 60-min test provided satisfactory results for all products.
For the comparison of dissolution profiles, similarity factor f2 and difference factor f1 are gaining popularity due to its recommendation by various regulatory committees. Dissolution profiles are considered similar if the calculated f2 value is between 50 & 100 and f1 value is between 1 & 15. The results of calculations of similarity factor and difference factor for reference and tests were found to be in acceptable limits.
REFERENCE / BIBLIOGRAPHY
1. D.M.Brahmanker, Sunil B.Jaiswal, Biopharmaceutics & pharmacokinetics Atreatise , Page no: 29-34 , 325-330 , 331-332.
2. Remington , The Science & Practice of Pharmacy , 21st edition-2005 , Volume-I , Chapter 35, Page no: 672-679.
3. Indian Pharmacoepia , published by Govt. of India , Ministry of Health & Family Welfare , 2007 , Volume II , Page no: 681-682 , 179-180.
4. T.Soni , N. Chotai , Assessment of dissolution profile of marketed Aceclofenac formulations , Journal of Young Pharmacists, Pharmaceutics , Year.2010 , Volume :2 , Issue :1 , Page no: 21-26 .
5. MD.Addnan Abdullah , Invitro Dissolution studies of different brands of sustained release Diclofenac sodium matrix tablet available in Bangladesh , Pak. J. Pharm. Sci., Vo.21, No.1, January 2008, page no: 70-77 .
6. E. Beyssac and J. Lavigne , Dissolution Study of Active Pharmaceutical Ingredients Using the Flow Through Apparatus Usp 4 , Dissolution Technologies , May 2005.
7. R Cartier, M Egen & M Kruger , In vitro System to assess the size-dependent dissolution profile of inhalable aerosols , Boehringer Ingelheim Pharma GmbH & Co. KG, Binger Str. 173, 55216 Ingelheim am Rhein, Germany.
8. Ana Barat Heather J. Ruskin Martin Crane, Probabilistic Methods for Drug Dissolution. Part 2. Modelling a Soluble Binary Drug Delivery System Dissolving in vitro, School of Computing, Dublin City University, Dublin, Ireland.
9. Aristides Dokoumetzidis , Panos Macheras , A century of dissolution research: From Noyes and Whitney to the Biopharmaceutics Classification System , International Journal of Pharmaceutics 321 (2006) , Page no :1–11.
10. Siriporn Okonogi and Satit Puttipipatkhachorn , Dissolution Improvement of High Drug-loaded Solid Dispersion , AAPS PharmSciTech 2006; 7 (2) Article 52.
11. Saeed A. Qureshi, Ph.D , Developing Discriminatory Drug Dissolution Tests and Profiles: Some Thoughts for Consideration on the Concept and Its Interpretation , Dissolution Technologies November 2006.
12. Vijaykumar Nagabandi, M.Santhosh Kumar , G.Prasad, K.Someshwar, A.Varaprasad , Comparative Dissolution Studies of Marketed Preparations and Treatment of Data by Using ANOVA , International Journal of Advances in Pharmaceutical Sciences 1 (2010) , Page no:142-146.
13. R. Kalaiselvan , GP Mohanta , PK Manna , R Manavalan , Studies on mechanism of enhanced dissolution of Albendazole soilid dispersions with crystalline carriers ,Indian Journal of Pharmaceutical Sciences , Year : 2006 , Volume : 68 , Issue : 5 , Page no : 599-607.
14. Vinod P.Shah, Yi Tsong, Pradeep Sathe and Roger L.Williams , Dissolution Profile Comparison Using Similarity Factor, f2 , Office of Pharmaceutical Science, Center for Drug Evaluation and Research Food and Drug Administration, Rockville, MD.
15. H. Saranadasa ,K. Krishnamoorthy , A Multivariate test for Similarity of two dissolution profiles , Journal of Biopharmaceutical Statistics, 15, 2005 , ISSN: 1054 , Page no :265–278.
16. Mukesh C.Gohel,Krishnakant G. Sarvaiya, Neelima R.Mehta, Chirag D. Soni, Vinita U.Vyas and Rikita K. Dave , Assessment of Similarity Factor Using Different Weighting Approaches , Dissolution Technologies , November 2005.
17. Mi-chia Ma, Ru-pyng Lin and Jen-pei Liu , Statistical evaluations of dissolution similarity , Statistica Sinica 9(1999), Page no : 1011-1027.
18. Mukesh C. Gohe and Maulik K. Panchal , Refinement of Lower Acceptance Value of the Similarity Factor f2 in Comparison of Dissolution Profiles , Dissolution Technologies , February 2002 .
19. K. Riviere, J. Duan , Investigating the impact of process parameters on similarity factor (f2) via a modeling approach , FDA/CDER/OPS/ONDQA.
20. J. Z. Duan, M. Shen, A. Chen, K. Riviere, Y. Tsong , Bootstrap f2 (Similarity Factor) for Dissolution Profile Comparisons , FDA/CDER/OPS/ONDQA, FDA/CDER/OTS/OB.
21. Duan JZ, Riviere K, Marroum P, In Vivo Bioequivalence and In Vitro Similarity Factor (f2) for Dissolution Profile Comparisons of Extended Release Formulations, Pharm Res. 2011 Feb 2.
22. P. Costa , An alternative method to the evaluation of similarity factor in dissolution testing , International Journal of Pharmaceutics, Volume 220 , Issues 1-2 , 4 June 2001 , Page no : 77-83 .
23. Vinod Shah , Yi Tsong , Pradeep Sathe , Jen-Pei Liu , In Vitro Dissolution Profile Comparison—Statistics and Analysis of the Similarity Factor, f2 , Office of Pharmaceutical Science, Center for Drug Evaluation and Research Food and Drug Administration, Rockville, MD.
24. PehKK , WongCF , Application of similarity factor in development of controlled release diltiazem tablet , Drug Dev Ind Pharm2000Jul , 26(7) , Page no :723-30.
25. Jordi Ocana , Gloria Frutos and Pilar Sanchez O , Using the similarity factor f2 in practice: A critical revision and suggestions for its standard error estimation , Chemometrics and Intelligent Laboratory Systems Volume 99, Issue 1, 15 November 2009, Pageno : 49-56.
26. Teja Soni, Chirag Nagda,Teja Gandhi, and N. P. Chotai , Development of Discriminating Method for Dissolution of Aceclofenac Marketed Formulations , Dissolution Technologies , May 2008.
27. Tajnin Ahmed, Afia Ferdous, Subrata Kumar Biswas, Farhana Sharif , Assessment of Dissolution Profile of Aceclofenac Tablets Available in Bangladesh , Stamford Journal of Pharmaceutical Sciences ISSN 1999-7108 , Vol 3, No 1 (2010).
28. Punit B. Parejiya, Bhavesh S. Barot, Hetal K. Patel, Pragna K. Shelat , Development and Characterization of Once a Daily Tablet Formulation of Aceclofenac , International Journal of Pharmaceutical Research 2010, Volume 2, Issue 4, ISSN 0975-2366 , Page no : 56-61.
29. Subramaniam Kannan, Rangasamy Manivannan, Kugalur Ganesan Parthiban Kakkatummal Nishad and Natesan Senthil Kumar , Formulation and Evaluation of Sustained Release Tablets of Aceclofenac using Hydrophilic Matrix System , International Journal of PharmTech Research CODEN (USA): IJPRIF ISSN , Vol.2, No.3 , Page no :0974-4304.
30. Sudhir Bhardwaj, Vinay Jain, R.C. Jat, Ashish Mangal, Suman Jain , Formulation and evaluation of fast dissolving tablet of Aceclofenac , International Journal of Drug Delivery 2 (2010) , ISSN: 0975-0215 , Page no : 93-97.
31. Santanu Ghosh and B. B. Barik , Preparation and evaluation of aceclofenac sustained release formulation and comparison of formulated and marketed product, International Journal of Medicine and Medical Sciences Vol. 1 (9) , September, 2009 , Page no : 375-382.
32. Hindustan Abdul Ahad, Chitta Suresh Kumar, Pilli Yesupadam, Harika B, Deepika D, Leela Lakshmi V, Chandra Sekhar A , Formulation and evaluation of once-daily sustained release Aceclofenac Prosophis juliflora gum matrix tablets , International Journal of Pharmaceutical Sciences Review and Research , Volume 1, Issue 2, March – April 2010; Article 005 ISSN 0976 – 044X.
33. Raosaheb S. Shendge , Fatima J. Sayyad , Kishor S.Salunnkhe and D.Bhalke , Development of colon specific drug delivery of Aceclofenac by using effective binder system of Ethyl acetate cellulose , International Journal of Pharma and Bio Sciences , ISSN 0975-6299 Vol.1/Issue-3/Jul-Sep.2010.
34. Deepali Gharge, Pandurang Dhabale , Simultaneous estimation of aceclofenac, tramadol hydrochloride and paracetamol by UV spectrophotometric simultaneous equation method from tablet formulation , International Journal of Chemical and Analytical Science 2010, 1(3), ISSN 0976 -1209 , Page no : 58-61.
35. Aejaz A , Azmail K , Sanaullah S , Mohsin A , Studies on Aceclofenac solid dispersion in corporated gels : Development , Characterisation and Invitro Evaluation , International Journal of Pharmacy and Pharmaceutical Sciences Vol 2, Suppl 1, 2010 .
36. H. Yadav,L. P. Kothapalli , A. N. Barhate, H. I. Pawar, C.R.Pawar , RP-HPLC method for determination of Aceclofenac , Chlorzoxazone and Paracetamol in bulk and pharmaceutical formulation , International Journal of Pharma Research and Development , IJPRD/2009/PUB/ARTI/VOV-1/ISSUE-10/DEC/001 , ISSN 0974 – 9446 .
37. G. Garg, Deependra Singh, Swarnlata Saraf and S. Saraf , Aceclofenac: A Potent Non-Steroidal Anti-Inflammatory Drug .


