 About Authors:
Nilesh Sovasia, Prof.Sanjeev Thacker, Arshad Hala
Seth G.L.Bihani S.D.College Of Technical Education,
Institute Of Pharmaceutical Science & Drug Research,
Sri Ganganagar, Rajasthan, India
*nilesh.sovasia@yahoo.com
ABSTRACT
X-rays have a smaller wavelength than visible light, they have higher energy. With their higher energy, X-rays can penetrate matter more easily than can visible light. Their ability to penetrate matter depends on the density of the matter, and thus X-rays provide a powerful tool in medicine for mapping internal structures of the human body.
[adsense:336x280:8701650588]
Reference Id: PHARMATUTOR-ART-1548
Introdruction Of X-rays:
X-rays are electromagnetic radiation with wavelengths between about 0.02 Å and 100 Å (1Å = 10-10 meters). They are part of the electromagnetic spectrum that includes wavelengths of electromagnetic radiation called visible light which our eyes are sensitive to (different wavelengths of visible light appear to us as different colors). Because X-rays have wavelengths similar to the size of atoms, they are useful to explore within crystals.
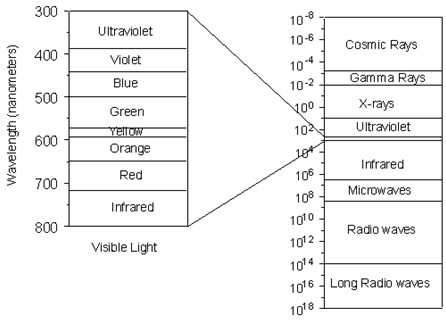
(Figure From tulane.edu/~sanelson/eens211/x-ray.pdf)
The energy of X-rays, like all electromagnetic radiation, is inversely proportional to their wavelength as given by the Einstein equation:
E = hν = hc/λ
where E = energy
h = Planck's constant, 6.62517 x 10⁻²⁷ erg.sec
ν = frequency
c = velocity of light = 2.99793 x 1010 cm/sec
λ = wavelength
Thus, since X-rays have a smaller wavelength than visible light, they have higher energy. With their higher energy, X-rays can penetrate matter more easily than can visible light. Their ability to penetrate matter depends on the density of the matter, and thus X-rays provide a powerful tool in medicine for mapping internal structures of the human body (bones have higher density than tissue, and thus are harder for X-rays to penetrate, fractures in bones have a different density than the bone, thus fractures can be seen in X-ray pictures).
Production Of X-rays:
X-rays are produced in a device called an X-ray tube. Such a tube is illustrated here. It consists of an evacuated chamber with a tungsten filament at one end of the tube, called the cathode, and a metal target at the other end, called an anode. Electrical current is run through the tungsten filament, causing it to glow and emit electrons. A large voltage difference (measured in kilovolts) is placed between the cathode and the anode, causing the electrons to move at high velocity from the filament to the anode target. Upon striking the atoms in the target, the electrons dislodge inner shell electrons resulting in outer shell electrons having to jump to a lower energy shell to replace the dislodged electrons. These electronic transitions results in the generation of X-rays. The Xrays then move through a window in the X-ray tube and can be used to provide information on the internal arrangement of atoms in crystals or the structure of internal body parts.
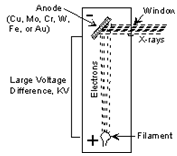
(Figure From tulane.edu/~sanelson/eens211/x-ray.pdf)
Continuous and Characteristic X-ray Spectra
When the target material of the X-ray tube is bombarded with electrons accelerated from the cathode filament, two types of X-ray spectra are produced. The first is called the continuous spectra.
The continuous spectra consists of a range of wavelengths of X-rays with minimum wavelength and intensity (measured in counts per second) dependent on the target material and the voltage across the X-ray tube. The minimum wavelength decreases and the intensity increases as voltage increases. The second type of spectra, called the characteristic spectra, is produced at high voltage as a result of specific electronic transitions that take place within individual atoms of the target material.
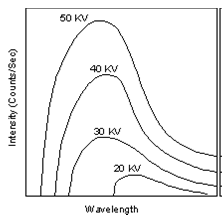
(Figure From tulane.edu/~sanelson/eens211/x-ray.pdf)
This is easiest to see using the simple Bohr model of the atom. In such a model, the nucleus of the atom containing the protons and neutrons is surrounded by shells of electrons. The innermost shell, called the K- shell, is surrounded by the L- and M - shells. When the energy of the electrons accelerated toward the target becomes high enough to dislodge K- shell electrons, electrons from the L - and M - shells move in to take the place of those dislodged. Each of these electronic transitions produces an X-ray with a wavelength that depends on the exact structure of the atom being bombarded. A transition from the L - shell to the K- shell produces a Kα X-ray, while the transition from an M - shell to the K- shell produces a Kβ Xray.
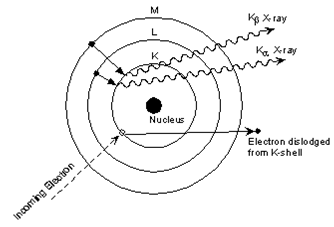
(Figure From tulane.edu/~sanelson/eens211/x-ray.pdf)
[adsense:468x15:2204050025]
These characteristic X-rays have a much higher intensity than those produced by the continuous sprectra, with Kα X-rays having higher intensity than Kβ X-rays. The important point here is that the wavelength of these characteristic x-rays is different for each atom in the periodic table (of course only those elements with higher atomic number have L- and M - shell electrons that can undergo transitions to produce Xrays). A filter is generally used to filter out the lower intensity Kβ X-rays.
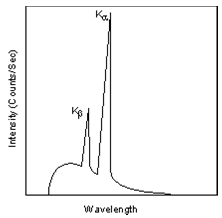
(Figure From tulane.edu/~sanelson/eens211/x-ray.pdf)
NOW YOU CAN ALSO PUBLISH YOUR ARTICLE ONLINE.
SUBMIT YOUR ARTICLE/PROJECT AT articles@pharmatutor.org
Subscribe to Pharmatutor Alerts by Email
FIND OUT MORE ARTICLES AT OUR DATABASE
X-ray Techniques:
A variety of X-ray techniques and methods are in use.But we shell classify all methods into three categories.These are X-ray absorption,X-ray fluorescence and X-ray diffraction methods.We shall discuss these one by one as follows:
(a) X-ray Absorption Methods- These are analogous to absorption methods in the other regions of electromagnetic spectrum.In these methods,a beam of X-rays is allowed to pass through the sample,and the attenuation or fraction of X-ray photons absorbed is considered to be a measure of the concentration of the absorbing substance.
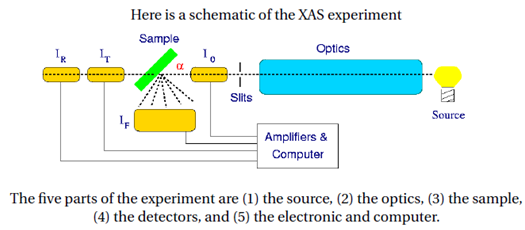
X-ray absorption methods are only helpful in certain cases like elemental analysis and thickness measurement.As compared with other X-ray methods,these are undoubtedly the least used.
(b) X-ray Diffraction Methods- These methods are based on the scattering of X-rays by crystals.By these methods,one can identify the crystal structures of various solid compounds.These methods are extremely important as compared with X-ray absorption and X-ray fluorescence methods.
(c) X-ray Fluorescence Methods- In these methods,X-rays are generated within the sample and by measuring the wavelength and the intensity of the generated X-rays,one can perform qualitative and quantitative analysis.X-ray fluorescence method is non destructive and frequently requires very little sample preparation before the analysis can be carried out.
Each of the above methods depends upon a different property of the radiation and each has specific application in analytical chemistry.For example,x-ray absorption is used to detect an imperfection in the internal structure of a physical body through which it passes;x-ray diffraction is used to determine crystalline structure.X-ray fluorescence is used for quantitative and qualitative elemental analysis.All these techniques are non-destructive.in many cases the application of x-ray analysis yields information which is unattainable from other instrumental procedures.
X-ray Diffraction and Bragg's Law
Since a beam of X-rays consists of a bundle of separate waves, the waves can interact with one another. Such interaction is termed interference. If all the waves in the bundle are in phase, that is their crests and troughs occur at exactly the same position (the same as being an integer number of wavelengths out of phase, nλ, n = 1, 2, 3, 4, etc.), the waves will interfere with one another and their amplitudes will add together to produce a resultant wave that is has a higher amplitude (the sum of all the waves that are in phase)
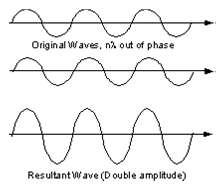
(Figure From tulane.edu/~sanelson/eens211/x-ray.pdf)
If the waves are out of phase, being off by a non-integer number of wavelengths, then destructive interference will occur and the amplitude of the waves will be reduced. In an extreme case, if the waves are out of phase by an odd multiple of 1/2λ [(2n+1)/2λ ], the resultant wave will have no amplitude and thus be completely destroyed.
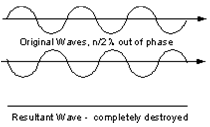
(Figure From tulane.edu/~sanelson/eens211/x-ray.pdf)
The atoms in crystals interact with X-ray waves in such a way as to produce interference. The interaction can be thought of as if the atoms in a crystal structure reflect the waves. But, because a crystal structure consists of an orderly arrangement of atoms, the reflections occur from what appears to be planes of atoms. Let's imagine a beam of X-rays entering a crystal with one of these planes of atoms oriented at an angle of θ to the incoming beam of monochromatic X-rays (monochromatic means one color, or in this case 1 discreet wavelength as produced by the characteristic spectra of the X-ray tube). Two such X-rays are shown here, where the spacing between the atomic planes occurs over the distance, d. Ray 1 reflects off of the upper atomic plane at an angle θ equal to its angle of incidence. Similarly, Ray 2 reflects off the lower atomic plane at the same angle θ. While Ray 2 is in the crystal, however, it travels a distance of 2a farther than Ray 1. If this distance 2a is equal to an integral number of wavelengths (nλ), then Rays 1 and 2 will be in phase on their exit from the crystal and constructive interference will occur.
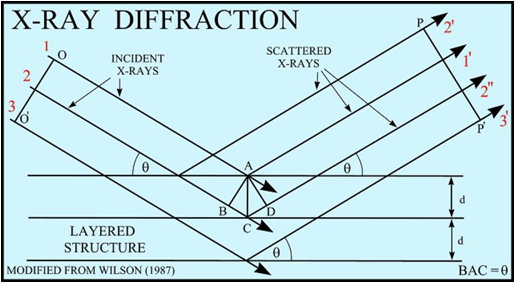
(Figure From pubs.usgs.gov/of/2001/ of01-041/htmldocs/xrpd.htm)
If the distance 2a is not an integral number of wavelengths, then destructive interference will occur and the waves will not be as strong as when they entered the crystal. Thus, the condition for constructive interference to occur is
nλ = 2a
but, from trigonometry, we can figure out what the distance 2a is in terms of the spacing, d, between the atomic planes.
a = d sin θ
or 2a = 2 d sin θ
thus, nλ = 2d sin θ
This is known as Bragg's Law for X-ray diffraction.
What it says is that if we know the wavelength ,λ , of the X-rays going in to the crystal, and we can measure the angle θ of the diffracted X-rays coming out of the crystal, then we know the spacing (referred to as d-spacing) between the atomic planes.
d = nλ /2 sin θ
Again it is important to point out that this diffraction will only occur if the rays are in phase when they emerge, and this will only occur at the appropriate value of n (1, 2, 3, etc.) and θ.
In theory, then we could re-orient the crystal so that another atomic plane is exposed and measure the d-spacing between all atomic planes in the crystal, eventually leading us to determine the crystal structure and the size of the unit cell.
The X-ray Powder Method
In practice, this would be a time consuming operation to reorient the crystal, measure the angle θ, and determine the d-spacing for all atomic planes. A faster way is to use a method called the powder method. In this method, a mineral is ground up to a fine powder. In the powder, are thousands of grains that have random orientations. With random orientations we might expect most of the different atomic planes to lie parallel to the surface in some of the grains. Thus, by scanning through an angle θ of incident X-ray beams form 0 to 900, we would expect to find all angles where diffraction has occurred, and each of these angles would be associated with a different atomic spacing.
The instrument used to do this is an xray powder diffractometer. It consists of an X-ray tube capable of producing a beam of monochromatic X-rays that can be rotated to produce angles from 0 to 900. A powdered mineral sample is placed on a sample stage so that it can be irradiated by the X-ray tube. To detect the diffracted X-rays, an electronic detector is placed on the other side of the sample from the Xray tube, and it too is allowed to rotate to produce angles from 0 to 900.
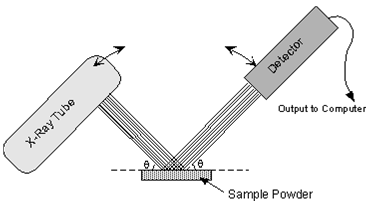
(Figure From tulane.edu/~sanelson/eens211/x-ray.pdf)
The instrument used to rotate both the X-ray tube and the detector is called a goniometer. The goniometer keeps track of the angle θ, and sends this information to a computer, while the detector records the rate of X-rays coming out the other side of the sample (in units of counts/sec) and sends this information to the computer.
After a scan of the sample the X-ray intensity can be plotted against the angle θ (usually reported as 2θ because of the way older diffractometers were made) to produce a chart, like the one shown here. The angle 2θ for each diffraction peak can then be converted to dspacing, using the Bragg equation.
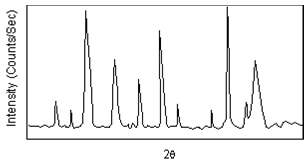
(Figure From tulane.edu/~sanelson/eens211/x-ray.pdf)
One can then work out the crystal structure and associate each of the diffraction peaks with a different atomic plane in terms of the Miller Index for that plane (hkl).
A group known as the Joint Committee on Powder Diffraction Standards (JCPDS) has collected data such as this on thousands of crystalline substances. This data can be obtained as the JCPDS Powder Diffraction File. Since every compound with the same crystal structure will produce an identical powder diffraction pattern, the pattern serves as kind of a "fingerprint" for the substance, and thus comparing an unknown mineral to those in the Powder Diffraction file enables easy identification of the unknown.
Fluorescence Methods
Principle:When an element in a beam of x-rays,the x-rays are absorbed.The absorbing atoms become excited and emit x-rays of characteristic wavelength.This process is called x-ray fluorescence.since the wavelength of the fluorescence is characteristic of the element being excited,measurement of this wavelength enables us to identify the fluorescing element.The intensity of the fluorescence depends on how much of that element is in the x-ray beam.Hence measurement of the fluorescence intensity makes possible the quantitative determination of an element.
For qualitative studies,the angle of diffraction θ is measured.From this measurement the wavelength λ of fluorescence can be calculated by using the Bragg equation,
nλ=2d sin θ
where d is the spacing between the crystal layers of the analyzing and is therefore known.Knowing λ,the wavelength of the fluorescence,we can identify the element from a chart of the fluorescence wavelengths of all the known elements.
If the element being determined is in two chemical forms,such as calsiun chloride and calcium sulfate,there is a very slight difference between the energy levels of the inner shell electrins of the calcium.This difference is too slighy to be detectable by x-ray fluorescence.Consequently,x-ray fluorescence is independent of the chemical form of the element being analyzed.This is sometimes a distinct advantage over many other forms of elemental analysis.
Application Of X-ray Powder Diffraction To Industrial Problems
The Dow Chemical Company has utilized X-ray powder diffraction (XRPD) for the identification of crystalline phases in practically every solid material imaginable. But beyond the classic use of XRPD, we have also applied the technique to understanding solid solutions, crystal structure, residual stress/strain, crystallite size, crystallinity, polymer morphology, mechanical texture, crystal phase quantitation, and kinetics. Advanced whole-pattern-fitting methods have made many of these applications practical and, in most cases, routine. Advances in instrumentation, including the development of synchrotron-based beamlines, have provided the necessary flux, resolution, and speed required for these analyses. In this talk, the methods for extracting various types of information from XRPD patterns will be examined, followed by a more detailed discussion of some industrial research and production problems where XRPD techniques were utilized to provide the answers.
Application Of X-ray diffraction
1. Structure of Crystals: The analytical applications of X-ray diffraction are numerous. The method is nondestructive and gives information on the molecular structure of the sample. Perhaps its most important use has been to measure the size of crystal planes. The patterns obtained are characteristic of the particulars compounds from which the crystal was formed.
For examples,as shown in figure1 NaCl crystals and KCl crystal give different diffraction pattern.A mixture containing 1%KCl in NaCl would show a diffraction patter of NaCl with a weak pattern of KCl.On the other hand,a mixture containing 1%NaCl in KCl would show the diffraction pattern of KCl with a peak pattern of NaCl.
If, on the other hand,the crystal is a mixed crystal of sodium potassium chloride,in which the sodium and potassium ions are in the same crystal lattice,there would be changes in the crystal’s lattice size,as shown in figure 2.When there is a large excess of sodium over potassium,the pattern would be similar to that of sodium chloride.However,as the potassium content increases,the lattice dimensions change accordingly until they equal that of the potassium chloride when there is a very large excess of potassium chloride present.This method can be used to distinguish between a mixture of crystals,which would give both diffraction pattern,and a mixed crystal,which would give a separate diffraction pattern.
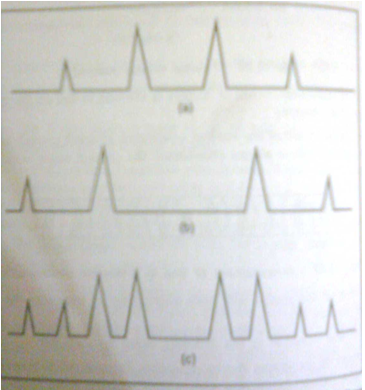
Figure 1: Hypothetical x-ray pattern of two salts:(a)x-ray pattern of salt A,(b)x-ray pattern of salt B,and (c)x-ray pattern of a mixture of salts A and B.
NOW YOU CAN ALSO PUBLISH YOUR ARTICLE ONLINE.
SUBMIT YOUR ARTICLE/PROJECT AT articles@pharmatutor.org
Subscribe to Pharmatutor Alerts by Email
FIND OUT MORE ARTICLES AT OUR DATABASE
Note that the peaks match those in (a) and (b).
(Figure From Chatwal G.R.,Anand S.K.,Instrumental Methods Of chemical Analysis: Arora M,Anand A,editors. X-Ray Absorption,Diffraction,and Fluorescence Spectrosopy (Crystal Tonography)Himalaya Publishing House:Page No.2.326)

Figure 2: X-ray pattern of a powdered mixed crystal of A and B.Note that the peaks fall between those in Fig.1(c),showing that lattice size does not coincide with that of Fig.1(a) or (b),but is between them.
(Figure From Chatwal G.R.,Anand S.K.,Instrumental Methods Of chemical Analysis: Arora M,Anand A,editors. X-Ray Absorption,Diffraction,and Fluorescence Spectrosopy (Crystal Tonography)Himalaya Publishing House:Page No.2.327)
Comparing diffraction patterns from crystals of unknown composition with patterns from crystals of known compounds permits the identification of unknown crystalline compounds.It is also possible to identify a substance as being a single compound that would give a superimposed pattern for each type of crystal present.
Modern instrumentation utilizes computers for identifying “unknown”samples.An example is illustrated in Fig.3.The unknown sample is put into the instrument and the x-ray diffraction pattern obtained.That pattern is then fed into a computer memory bank which contains the diffraction pattern of a large number of known compounds.The computer is instructed to compare the diffraction pattern of the unknown compound with those of the known compounds and report which of these the unknown might be.
The computer displays a short list of compounds.
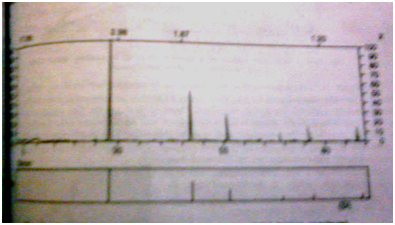
Fig.3 : X-ray diffraction patten of unknown material (upper spectrum).
The lower spectrum was retrieved from the memory bank and is of silica.
(Figure From Chatwal G.R.,Anand S.K.,Instrumental Methods Of chemical Analysis: Arora M,Anand A,editors. X-Ray Absorption,Diffraction,and Fluorescence Spectrosopy (Crystal Tonography)Himalaya Publishing House:Page No.2.327)
The operator may then instruct it to display the x-ray diffraction patterns of these compounds or visual inspection and composition with the unknown.The operator selects the most likely candidate for the identification of the unknown compound and is at liberty to perform other confirmatory tests if necessary.Fig.C shows the pattern of an unknown and that of a compound retrieved from the computer’s memory bank.In this case the unknown was silica and the fit between the two spectra was good.
2 Polymer Characterisation
Powder method can be used to determine the degree of crystallinity of the polymer.The non crystalline portion simply scatters the X-ray beam to give a continuous background,while the crystalline portion causes diffraction lines that are not continuous.A typical diffraction spectrum of a polymer is shown in Figure.The amorphous material in the polymer will scatter at all wavelengths and give a scatterd pattern;however,the crystalline material will include crystal structures and will produce definite diffraction lines or spots.The ratio of the area of diffraction peaks to scattered radiation is proportional to the ratio of crystalline to non crystalline material in the polymer.The ultimate quantitative analysis must be confirmed by using standard polymers with known crystallinities and basing the calculation on the known ratio of crystalline diffraction to amorphous scattering.
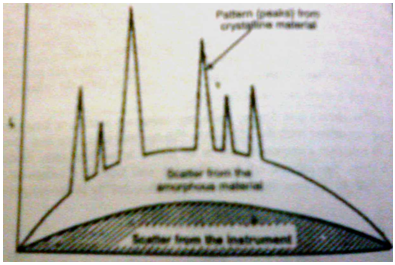
Diffraction pattern of a polymer showing crystalline,amorphous and scattered radiation components.
(Figure From Chatwal G.R.,Anand S.K.,Instrumental Methods Of chemical Analysis: Arora M, Anand A,editors. X-Ray Absorption, Diffraction, and Fluorescence Spectrosopy (Crystal Tonography)Himalaya Publishing House:Page No.2.328)
By measuring the intensity of diffraction patterns in several direction of a crystal,it is possible to determine if the crystals of a polymer or a metal are oriented in any particular direction.Preferred orientation can occur after the material has been rolled out into a sheet.This is sometimes a very undesirable property,since the material may be very weak in one direction and stronger in another,with the result that it tears easily in one direction.Sometimes,however,this is a desirable property,as for example,in wrapping material that we may wish to tear easily to open,such as cigarette package wrappings.
In polymer chemistry a great deal of information can be obtained from a X-ray diffractiondiagram.Fibers and partially oriented samples will show spotty diffraction patterns than uniform cones,the more oriented the specimen,the spottier the pattern.The layer line spots arise by diffraction from planes that intersect the fiber axis.The repeat distance along the polymer chain can be calculated from the distances of the layer lines from the equator and their separation from one another.in the simplest cases the repeat distance will correspond to that of a fully extended chain of the known chemical composition.
3 State of anneal in metals
A property of metals than can be determined by x-ray diffraction is the state of anneal.Well-annealed metals are in well-ordered crystal from and give sharp diffraction lines.If the metal is subjected to drilling,hammerin,or bending,it becomes “worked”,or “fatigued”,that is,its crystals become broken and the x-ray pattern more diffuse.Fatigue weakens the metal and can result in the metal breaking.It is occasionally necessary to check moving parts for metal fatigue,such as airplane wings (which move slightly durinr flight),combustion engine parts and brides.This check can be done by x-ray diffraction without removing the part from its position and without weakning,it in the process of testing.These advantages of x-ray testing are frequently very important,particularly if the sample will continue to be used after testing.
4 Particle Size Determination
A variety of X-ray techniques may be used to determine the size of particles or crystallities.
(a)Spot Counting Method-This method is used for determining size of particles larger than 5 microns.If the powder diffraction pattern of such a specimen is obtained,it will consist of a series of lines or rings having a spotty appearance.From this diffraction pattern,one can determine the size of particles by applying the following relation:
v = V.δθ.cosθ/2n
where v=the volume or size of individual crystallite,
V=the total volume of the specimen irradiated,
n=the number of spots in a diffraction ring at a Bragg angle of θ,and
δθ=the divergence of the X-ray beam and is a function of the apparatus used.
By this method,it is not possible to obtain the volume or size of the particle with any degree of accuracy.Generally a series of sample having particles of known sizes is used to obtain diffraction rings that may be compared with those from the unknown at similar values of θ.
Another disadvantages of this method is that spots due to strained particles are difficult to count.One more disadvantage is that if the few grains present in the arradiated volume posssess a preferred orientation,inaccuracies may arise.
(b)Broadening Of Diffraction Lines-This method is used for particles in the range 30-1000Å.This method is based upon the simple fact that there is broadening of the powder diffraction lines.for a powder composed of perfect crystalline particles in this size range,we know.
Lhkl=Kλ/β0cosθ
Where Lhkl=the mean crystalline dimension (size) perpendicular to the plane (hkl),
β0= the breadth at half maximum of a pure diffraction profile in radians and
K=a constant,generally taken as unity.
In reality,the breadth of a diffraction line,bM,measured from the diffraction pattern depends upon the instrumental factors as well as on the particle size.Thus,the measured line breadth bM is due to instrumental,β1,and small crystalline (particle),β0,line broadening.
In a practice, the unknown sample is mixed with a standard substance having a particle size greater than 1000Å (so that β0 for the standard is zero) and then the diffraction pattern obtain which produce a diffraction line near that from the unknown to be used in the measurement.Then,if the line profiles are considered to be Gaussian,one can write,
Β2M(unknown)=β12 + β02(unknown)
And β2M(standard) = β12
Hence β20(unknown)= β2M(unknown) – β2M(standard)
From the above equation,one can estimate the crystallite dimension (size) Lhkl
(c)Low-angle scattering-From the Bragg relation,nλ=2d sinθ,it follows that if one desire to have information about large structural features (i.e.,large d values),attention should be focussed on small scattering angles,2θ.For system having a collection of particles identical in shape and size and separated sufficiently to eliminate inter-particle interference (i.e.dilute,non-despersive system),Guinier proved the following relation,
lnIs = lnI0 – 1/3 [4πθR/λ]2
where Is denotes the variation in scattered intensity with angle θ,I0 the intensity scattered at zero angle,and R the radius of gyration of the particles.Thus if ln Is is plotted against (4πθ/λ)2,a straight line having slope -1/3 R2 should be obtained.From this slope,the radius of gyration,R,can be calculated.The value of R calculated by this method is an average radius of gyration.
This method holds good for spherical and near-spherical particles.
Application of Diffraction Methods to Complexes
Determination of Cis-Trans Isomerism-X-ray diffraction study has been used to make the distinction between cis and trans isomers of a complex.An interesting example is the structure of bis (pyridine-2-carboxamido) nickel (???) dihydrate.This is abbreviated as Ni (pia)2.2H2O.
The orange-red,diamagnetic crystal of compositior, Ni (pia)2.2H2O are obtained when an aqueous solution of nickel (??) chloride is added to an alkaline solution of the ligand.From X-ray studies it reveals that the complex molecules possesses a trans planar structure,and the two ligands are coordinated with the nickel atom through four nitrogen atoms.The water molecules do not coordinate directly with the nickel atom but are situated between the complex molecules;they are hydrogen-bonded with each other and are link to the amido oxygen atoms of the complex molecule as shown in figure.
NOW YOU CAN ALSO PUBLISH YOUR ARTICLE ONLINE.
SUBMIT YOUR ARTICLE/PROJECT AT articles@pharmatutor.org
Subscribe to Pharmatutor Alerts by Email
FIND OUT MORE ARTICLES AT OUR DATABASE
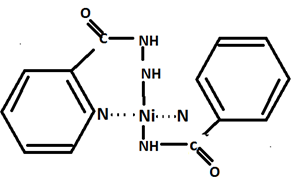
Structure of bis (pyridine-2-carboxamido) nickel (??)
Application Of X-ray Fluorescence In enviromental science
Introduction
X-ray fluorescence (XRF) is a well-established technique for fast quantitative and qualitative elemental analysis. One very important area which is seeing increased interest is environmental science. XRF is already providing useful information for scientists working in this field, whether it be for quantitative analysis of contaminants in soils, identification of radioactive elements (e.g. uranium), composition analysis of rocks and minerals, characterisation of materials for recycling etc.
In recent years, developments in x-ray optics and the ability to create high intensity microscopic x-ray beams has led to a new generation of laboratory energy dispersive XRF instruments capable of analysing discrete particles as small as 10 μm, and scanning surfaces to create fast high-resolution elemental images. With mono-capillary optics well collimated beams are possible, with diameters ranging from a millimetre down to a few micrometres, providing % and sub-% concentration for the elements from sodium upwards. This removes the need for traditional sample preparation, and even large samples can be analysed whole, while individual features can be interrogated to produce a detailed characterisation of elemental composition. In the case of environmental sciences for which the studied samples are generally disordered, heterogeneous and/or fragile, non-destructive X-ray fluorescence micro-analysis is an ideal technique.
Industry has quickly grasped this technology with confidence as a method of ensuring compliance to the new RoHS (Restriction of the use of certain Hazardous Substances in Electric and Electronic Equipment)directive.Micro XRF allows even minute electronic components and circuitry to be individually analysed in a matter of seconds or minutes, with sensitivity well within the limits defined in the directives. As a fast, routine screening tool, the technique is unrivalled.
However, beyond this very active embrace of micro-XRF there are numerous other areas where the same technology is helping researchers to study and protect our environment.
Terrestial and extra-terrestial dust particles
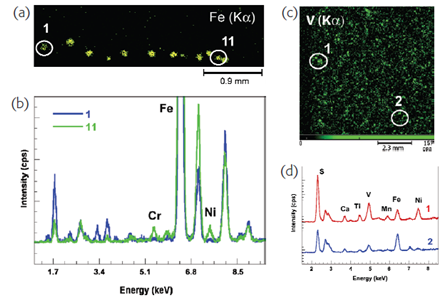
Perhaps the most obvious application of micro-XRF is for the analysis of individual microscopic particles, where more traditional techniques such as bulk/macro XRF or ICP are not applicable. Figure 1(a) shows an elemental image acquired over a number of micrometeorite particles all of which are less than 100 μm in diameter. The earth is constantly bombarded by such extra-terrestial dust, which is believed to be a fundamental building block in the formation of planets, and a pathway for the introduction of vital mineral materials to the young planet Earth. Such samples are nevertheless rare and require non-destructive analysis. Moreover the composition of micrometeorites is generally altered at the surface (to a depth of a few microns) depending on the time spent within the terrestial atmosphere. Therefore surface-only techniques like SEM-EDX are unable to provide chemical analysis of the near-surface to bulk regions—the deeper penetration of XRF analysis thus provides additional information. Spot analysis of two of these grains [Figure 1(b)] clearly shows that their material composition can be identified and distinguished with analysis times of just 60 s.
(Figure From Fitzgerald S,Chaurand P,Rose J,X-ray fluorescence micro-analysis for environmental science,Available from URL: spetroscopyeurope.com)
Figure 1. (a) elemental image (Fe Kα) of micrometeorites, acquired with 10 μm beam, (b) spectra obtained from micrometeorites 1 and 11, (c) elemental image (V Kα) of petrochemical dust, and (d) spectra obtained from high and low vanadium concentration particles.
Figure 1(c) shows far more numerous atmospheric particles caused by petrochemical industrial processes—these contain vanadium, a toxic pollutant which can cause various harmful effects in humans, particular in the lungs, eyes, nose and throat. Quantitative analysis of these particles collected on filters identifies two main forms, with significant differences in V, S, Fe and Ni concentrations. Understanding particle composition provides useful information on their toxicity, but such analysis is impossible with non-spatially resolved techniques.
Recycling waste: Reuse of steel slag
Basic Oxygen Furnace (BOF) steel slag is obtained during the transformation process of pig iron to steel in LD converters and is attractive as a construction material due to its excellent technical material properties. This by-product is mainly composed of Fe, Ca, Si but also contains trace elements potentially harmful to the environment like Cr. Therefore the decision to reuse them should be based on solid knowledge of their environmental impacts particularly from the durability aspect. A SIMPLe-to-use Interactive Self-modeling Mixture Analysis (SIMPLISMA) of the micro-XRF data [chemometric analysis of micro-XRF (multipoint mode)] clearly indicates two different Cr locations in BOF slag: a solid solution phase (Fe, Mn, Mg)O and a dicalcium aluminoferrite phase (Brownmillerite). Both of these phases remain unaltered when BOF slags are in contact with water, which clearly explains the low level of Cr release during leaching tests.
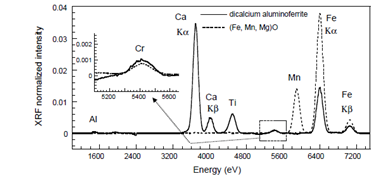
Figure 2. Resolved spectra obtained with SIMPLISMA procedure
(Figure From Fitzgerald S,Chaurand P,Rose J,X-ray fluorescence micro-analysis for environmental science,Available from URL: spetroscopyeurope.com)
Conclusions
The ability to analyse individual microscopic particles for composition and create detailed elemental images with compact benchtop micro-XRF analysers is being widely embraced by scientists in varied application areas, including forensics, pharmaceutics, geology, materials and electronics. For environmental scientists, the move from older bulk XRF techniques to the latest microscopic techniques can provide a new dimension in their research, and provide insight to the earth and the universe, and the impact mankind is having.
REFERENCES
1. Chatwal G.R.,Anand S.K.,Instrumental Methods Of chemical Analysis: Arora M,Anand A,editors. X-Ray Absorption,Diffraction,and Fluorescence Spectrosopy (Crystal Tonography)Himalaya Publishing House:2.302-2.339
2. Jeffery G.H,Bassett J,Mendham J,Denney R.C,VOGEL’s textbook of Quantitative Chemical Analysis,Fifth edition 8-9
3. Jag Mohan,Organic Analytical Chemistry Theory and Practice,Narosa Publishing House 414-423
4. Willard H.H,Merritt L.L,Dean J.A,Settle F.A;X-Ray Methods,seventh edition,CBS Publishers & Distributors,New Delhi 340-397
5. X-ray crystallography,Available from URL: tulane.edu/~sanelson/eens211/x-ray.pdf [Accessed 2011 Jan 14 01:42 pm]
6. Applications of X-Ray Absorption Spectroscopy,Available from URL: feff.phys.washington.edu/~ravel/
7. Fitzgerald S,Chaurand P,Rose J,X-ray fluorescence micro-analysis for environmental science,Available from URL: spetroscopyeurope.com [Accessed 2011 Jan 19]
8. URL: pubs.usgs.gov/of/2001/ of01-041/htmldocs/xrpd.htm [Accessed 2011 Feb 17]
9. X-ray crystallography availabe at tulane.edu/~sanelson/eens211/x-ray.htm [Accessed 2012 Octo 31]
NOW YOU CAN ALSO PUBLISH YOUR ARTICLE ONLINE.
SUBMIT YOUR ARTICLE/PROJECT AT articles@pharmatutor.org
Subscribe to Pharmatutor Alerts by Email
FIND OUT MORE ARTICLES AT OUR DATABASE


